Site pages
Current course
Participants
General
Module 1. Perspective on Soil and Water Conservation
Module 2. Pre-requisites for Soil and Water Conse...
Module 3. Design of Permanent Gully Control Struct...
Module 4. Water Storage Structures
Module 5. Trenching and Diversion Structures
Module 6. Cost Estimation
Lesson 27. Farm Ponds
Farm ponds have a significantly role in rainfed farming system where annual rainfall is more than 500 mm. It helps in mitigating the ill effect of rainfall variability as it stores water from rainfall excess and provides for utilization during prolonged dry spells by means of supplemental/protective irrigation. It also helps in pre-sowing irrigation of rabi crop. In high rainfall semi-arid regions of India, farm pond can be used for multiple uses such as protective/supplemental irrigation, fish culture, duck farming integrated with poultry.
27.1 Types of Farm Ponds
Broadly farm ponds can be categorized into two type i.e. embankment type and excavated or dugout type.
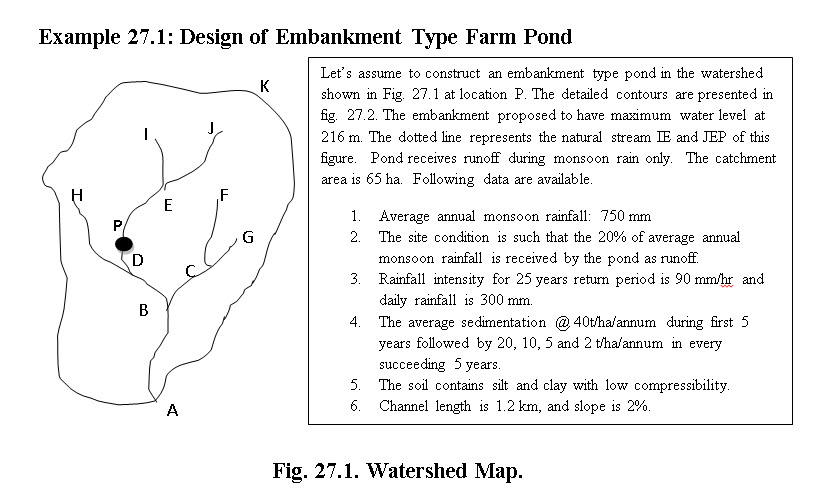
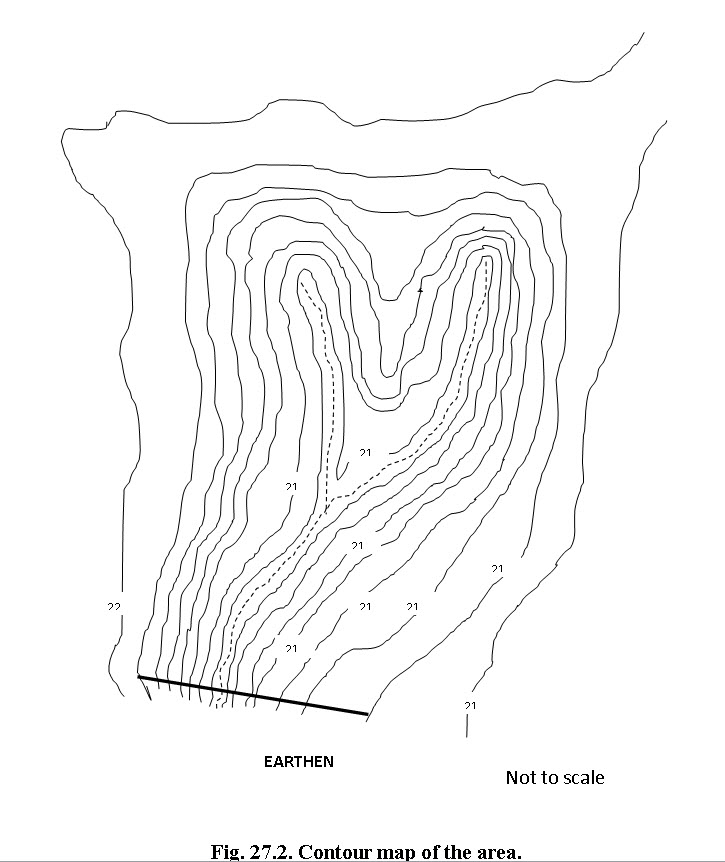
27.2 Embankment Type
These type farm ponds are constructed across the stream or water course and consist of an earthen dam. Dimension of embankment are determined based on the required storage. These ponds are suitable for areas having gentle to moderately steep slope and also where stream valleys are sufficiently depressed to permit a maximum storage volume with least earth work. Given the Indian farming system, this type of pond is constructed largely at common land resources as it requires substantial land under submergence.
27.2.1 Capacity of the Ponds
The capacity of the pond is calculated using trapezoidal or Simpson’s rule. In trapezoidal rule, the volume of storage ![]() between two successive contours is given as:
between two successive contours is given as: ![]() , in which his contour interval and and are area bounded by upper and lower contour respectively.
, in which his contour interval and and are area bounded by upper and lower contour respectively.
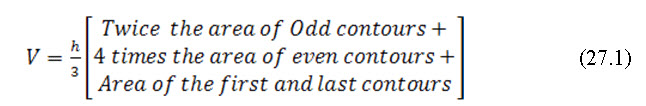
In Simpson rule which is more accurate than trapezoidal method, the volume is estimated as:
The design aspect of earthen embankment has been discussed in lessons 23 and 24. Like any hydraulic structures, the embankment design also includes hydrologic design, hydraulic design and structural design.
The storage capacity at different heights of the embankment is presented in Table 27.1.
Table 27.1Storage capacity at different height of embankment
|
Contour level |
Contour Interval |
Maximum Water Depth |
Area Bounded by (Ha) |
Incremental Volume, Using Trapezoidal Method (ha-m) |
Cumulative volume (ha-m) |
|
|
Upper contour, Au |
Lower Contour, Al |
|
|
|||
|
211 |
1 |
0 |
0.4 |
0 |
0.20 |
0.20 |
|
212 |
1 |
1 |
1.5 |
0.4 |
0.95 |
1.15 |
|
213 |
1 |
2 |
2.6 |
1.5 |
2.05 |
3.20 |
|
214 |
1 |
3 |
3.7 |
2.6 |
3.15 |
6.35 |
|
215 |
1 |
4 |
4.3 |
3.7 |
4.00 |
10.35 |
|
216 |
1 |
5 |
5.6 |
4.3 |
4.95 |
15.30 |
|
217 |
1 |
6 |
6.5 |
5.6 |
6.05 |
21.35 |
Like drop structures, here also the pond is designed under heading of hydrologic design, hydraulic design and structural design.
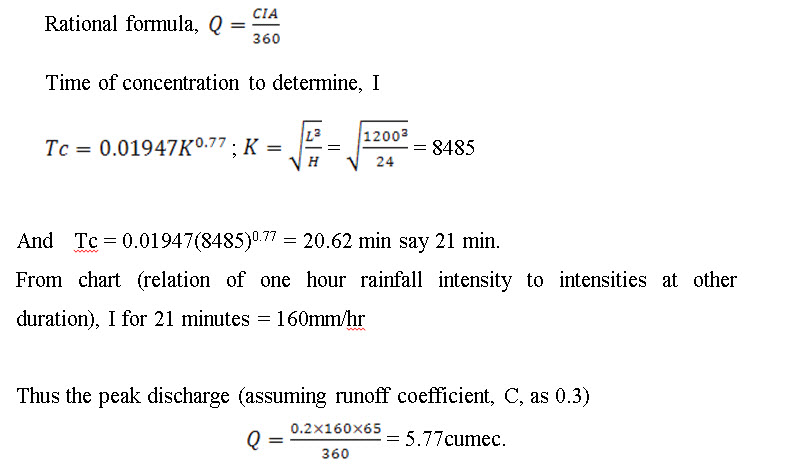
A. Hydrologic design
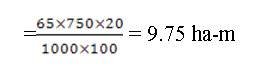
(i) Water Yield Estimation
Average annual monsoon rainfall =750 mm. Expected runoff volume or water yield from 65 ha catchment considering 20% of the rainfall as the runoff
(ii) Estimation of Peak Discharge
(B) Hydraulic Design
(i) Storage Capacity
Total storage capacity = live storage+dead storage
Live storage: 9.75 ha-m as determined from hydrologic design
Dead storage:
First 5 years @40 t/ha/annum = 200 t/ha
5-10 years @ 20 t/ha/annum = 100 t/ha
10-15 years @10 t/ha/annum = 50 t/ha
15-20 years @5 t/ha/annum = 25 t/ha
20-25 years @ 210 t/ha/annum = 1050 t/ha
Total = 385 t/ha
Total sediment yield during 25 years from 65 ha catchment
= 25 X 385 = 9625 ton
Assuming the bulk density of the sediment as 1.5 g/cc,
1 ha-m of sediment = 15000 tonnes
Thus dead storage = 9625/15000 = 0.64 ha-m.
Thus total storage capacity required = 9.75+0.64 = 10.39 ha-m.
From storage capacity table, the dead storage of 0.64 corresponds to 212 m contour level which will the top level of dead storage. The total capacity of 10.91 ha-m corresponds to 215.2 m contour. Thus the net height of the embankment at maximum water level will be 215.2 - 211 = 4.2 m. in which maximum water depth would be 3.2 meter.
(iii) Height of the Embankment
Height of water upto full level = 215.2 – 211.0 = 4.2 m
Height of free board (15%) = 15% of 4.2 m = 0.63 m.
Wave height for a fetch of 1.5 km,
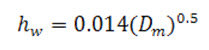 = 0.542m
Since free board is more than wave height, free board will be considered.
Height of embankment will be 4.2+0.63 = 4.83. Add 5% settlement allowance thus height will be 4.83+5% = 5.07 m.
Location of principal spillway = at maximum water level = 215.2 m level.
Location of emergency spillway = 211 + 5.07 = 216.07 m level.
Thus the temporary storage between emergency spillway level and principal storage level will be
16.5 ha-m (at 216.07 m level) – 10.91(at 215.2 m level) = 5.59 ha-m
(ii) Design of Principal Spillway
24-hour maximum rainfall at 5 percent probability level is 300 mm with 30% resulted into runoff. Thus expected storm runoff =  = 5.85 ha-m. This principal spillway are mostly in the form of drop inlet spillway. Thus standard RCC pipes are selected from the manufacturer and laid at proper grade such that the condition of pipe running full could be obtained.
Designing drop inlet spillway (principal spillway)
The design discharge for drop inlet spillway is determined by the following relationship (Singh et al. 1990). Procedure is already discussed in case of drop inlet spillway design earlier. However, for the sake of completion of design it is also given here.
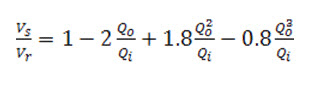
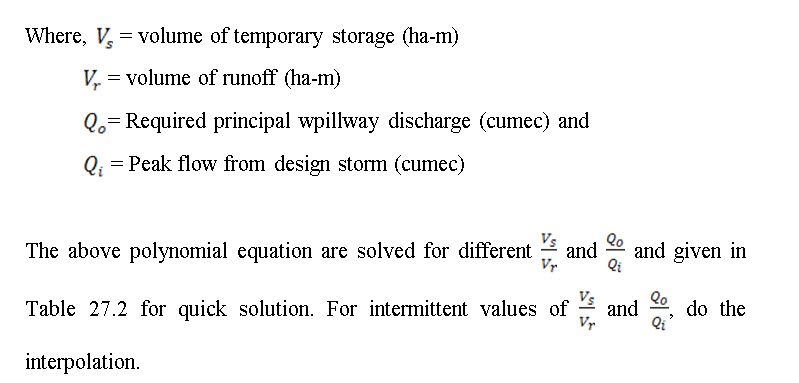
The above polynomial equation are solved for different ![]() and
and ![]() given in Table 27.2 for quick solution. For intermittent values of
given in Table 27.2 for quick solution. For intermittent values of ![]() and
and ![]() , do the interpolation.
, do the interpolation.
Table 27.2. Estimating principal spillway discharge allowing for temporary storage (for watershed of less than 100 ha)
|
|
|
|||||||||
|
|
0.00 |
0.01 |
0.02 |
0.03 |
0.04 |
0.05 |
0.06 |
0.07 |
0.08 |
0.09 |
|
0.0 |
1.00 |
0.99 |
0.98 |
0.96 |
0.95 |
0.94 |
0.92 |
0.91 |
0.90 |
0.88 |
|
0.1 |
0.87 |
0.85 |
0.84 |
0.82 |
0.81 |
0.79 |
0.78 |
0.76 |
0.74 |
0.73 |
|
0.2 |
0.72 |
0.70 |
0.68 |
0.67 |
0.65 |
0.64 |
0.62 |
0.61 |
0.60 |
0.58 |
|
0.3 |
0.57 |
0.55 |
0.54 |
052 |
0.51 |
0.50 |
0.49 |
0.47 |
0.46 |
0.45 |
|
0.4 |
0.44 |
0.43 |
0.42 |
0.41 |
0.40 |
0.39 |
0.38 |
0.37 |
0.36 |
0.35 |
|
0.5 |
0.34 |
0.33 |
0.32 |
0.31 |
0.30 |
0.29 |
0.28 |
0.27 |
0.27 |
026 |
|
0.6 |
0.25 |
0.24 |
0.23 |
0.23 |
0.22 |
0.21 |
0.20 |
0.20 |
0.19 |
0.18 |
|
0.7 |
0.18 |
0.17 |
0.16 |
0.15 |
0.15 |
0.14 |
0.14 |
0.13 |
0.12 |
0.12 |
|
0.8 |
0.11 |
0.11 |
0.10 |
0.09 |
0.09 |
0.08 |
0.08 |
0.07 |
0.07 |
0.06 |
|
0.9 |
0.05 |
0.05 |
0.04 |
0.04 |
0.04 |
0.03 |
0.02 |
0.02 |
0.01 |
0.01 |
(Source: Singh et al. 1990)
Here ![]() = 5.59 ha-m,
= 5.59 ha-m, ![]() = 5.85 ha-m;
= 5.85 ha-m; ![]() = 6 cumec.
= 6 cumec.
Thus ![]() = 0.96, for this ratio,
= 0.96, for this ratio, ![]() = 0.02 (from above table)
= 0.02 (from above table)
And so ![]() = 0.02 X 6 = 0.12 cumec
= 0.02 X 6 = 0.12 cumec
Thus select the suitable RCC pipe which is capable to handle 120lps discharge.
(iii) Design of Emergency Spillway
Expected peak discharge = 6.0 cumec
Discharge through principal spillway = 0.12cumec
So, design discharge for emergency spillway = 6.0 – 0.12 = 5.88cumec.
So at the level 216.07 m, chute spillway should be constructed for the capacity of 5.88cumec (see design of chute spillway).
(c)Structural Design
Top width = H/5+1.5 = 5.07/5+1.5 = 2.01 m say 2 m.
U/s and D/s slope = 3:1 and 2.5:1
Provide berm of 2.0 meter at the level of 215.2 m i.e. at the level of principal spillway to install pipe inlet.
27.3 Excavated or Dugout Ponds
These types of farm ponds are small dug out structures with well-defined shape and size. These structures have provision for inlet and outlet. Farm ponds are constructed at lower portion of the farm and generally stored water is used for irrigation. In some places farm ponds are used for recharging groundwater. However, for recharging groundwater, high capacity structures located in the highly permeable soil are more suitable. These structures are also called percolation tank (Reddy et al. 2012).
Dugout ponds are constructed by excavating the soil from the ground and the excavated soil is used to make embankment around the pond. The pond could either be fed by surface runoff or groundwater wherever aquifers are available. The depth and size of pond depend upon the volume of water to be stored. This type of pond is more featured in individual farm. Dug-out ponds can be grouped into the following four categories:
Excavated or dug out ponds
Surface ponds
Spring or creek fed ponds and
Off stream storage ponds
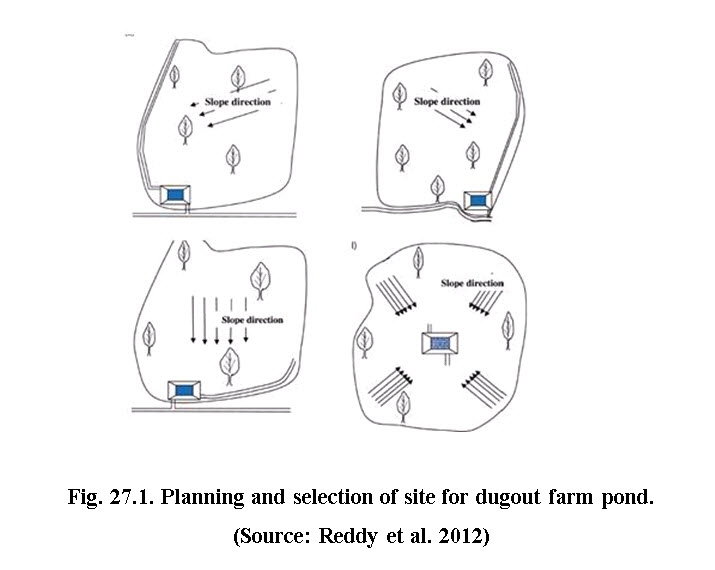
27.3.1 Excavated or Dugout Ponds
Excavated pond site should be chosen based on general slope of the field. Various locations of dug-pond are illustrated in Fig. 27.1 based on the prevailing land slope. If slope is towards left bottom corner of the field, a form pond must be constructed in the left corner of the plot and similarly for slope towards right bottom corner. If the slope is towards the bottom of the field, pond can be constructed at either side corner with proper field channel at the bottom of the field connecting to the inlet of the structure. If the farm area has multiple slopes in different direction, pond should be located in a portion of the area where maximum water can be drained into the structure.
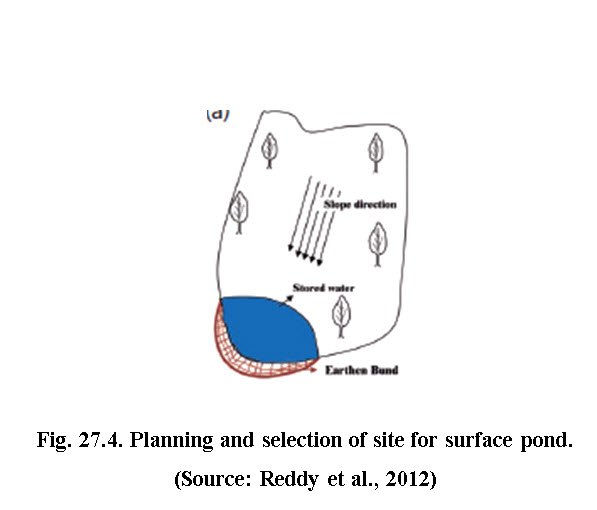
27.3.2 Surface Pond
When the surface runoff from a farm area is collected into a local depression or the lowest portion of the farm such that the excavation is minimum, this type of pond is called surface pond (Fig. 27.2). Surface pond is possible in the farm area with undulating topography. This type of pond does not require a formal inlet provision but it should have formal outlet provision.
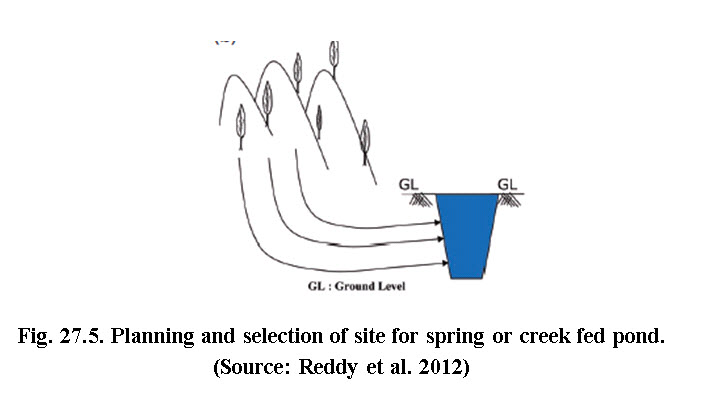
27.3.3 Spring or Creek Fed Ponds
This type of pond is generally constructed at the foothills of the hilly catchments. After the soil saturation occurred due to excess rainfall, the subsurface flow of the catchment oozes up to the surface at the foothills as base flow (Fig. 27.3).
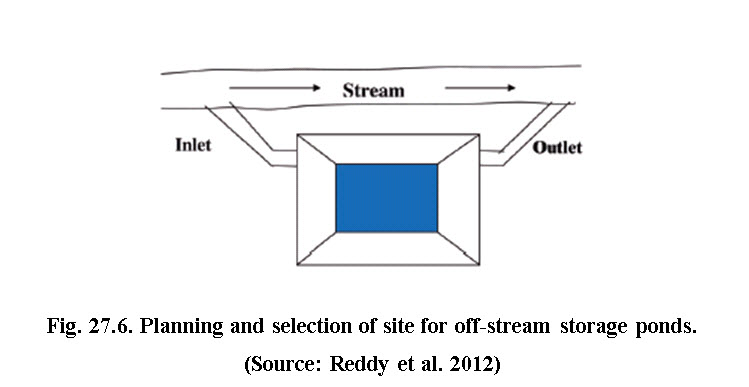
27.3.4 Off Stream Storage Ponds
This type of pond should be adopted where construction of embankment across the natural channel is not feasible or economically viable. Off-stream storage ponds collect water from the stream using diversion (Fig. 27.4). In hilly catchment where, storage volume upstream of embankment of dam is not sufficient and unable to sustain the high flow velocity, these types of structure can be adopted.
27.4 Site Selection for Dugout Type Farm Pond
The site selection for a single or multiple pond system requires careful planning considering several variables. These include local soil condition, topography, drainage capacity, infiltration and rainfall pattern and its distribution. A suitable pond site should be selected to ensure long-term success. Generally such area should be selected where a limited amount of excavation is required to contain, or hold back, a large volume of water. However, the specific selection criteria for different type of ponds are explained in detail by Reddy et al.(2012).
Soil type
Soil type is also playing a major role in deciding the site for farm ponds. The soils having stones and boulders should be avoided for digging farm ponds particularly when pond is to be remained unlined. The soil profile must be investigated and location with good soil depth, free of stones, low Ph, EC and ground water level can be selected for farm ponds.
Topography
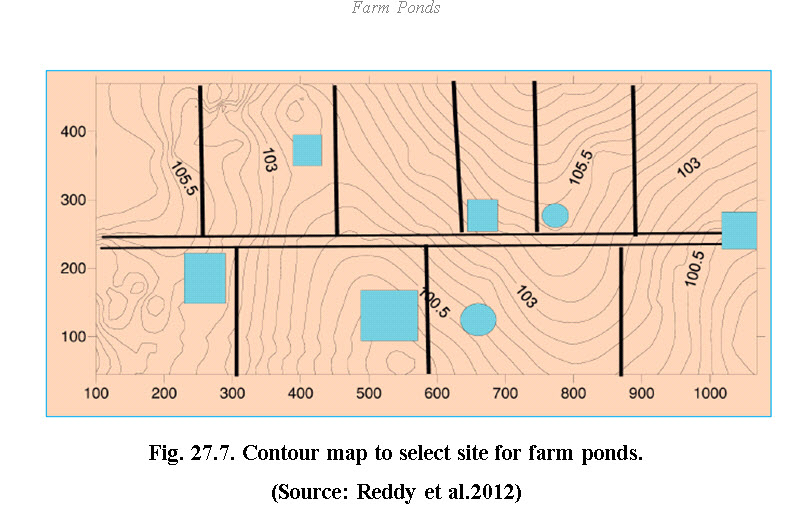
The proposed pond construction should be based on the topographic features of the site such that higher excavation to storage ratio could be achieved to attain the economy. Depending upon the capacity of the farm pond, contour survey should be conducted. However for smaller catchment (less than 5 ha), a reconnaissance survey is sufficient. Fig. 27.5 presents a sample contour map and respective location of ponds (Reddy et al. 2012).
27.5 Design Approach for Dugout Farm Ponds
Rainfall is the most important hydrological parameters for design of farm ponds. The design approach includes determination of design rainfall, probability analysis, surface runoff or water yield, rainfall-runoff relationship of the catchment, shape of the pond and utilization.
Design rainfall
The design rainfall refers to the quantum of rain required during the cropping season in catchment area to provide sufficient runoff to meet the crop water requirement. The design rainfall is very delicate preposition: if actual rainfall is less than design rainfall in cropping season, moisture stress will occur but when actual rainfall is more than design rainfall, surplus runoff may cause damage to the structure. Thus proper probability analysis of the historical rainfall event of the area should be carried out.
Probability analysis
Long term rainfall data, as long as possible but not less than 20 years, is required for carrying out probability analysis. Plotting position method is used for carrying probability analysis. Steps for probability analysis are given below:
Arrange the annual/season rainfall data in descending order and rank them such that maximum value gets rank 1 and minimum value with maximum rank (rank should be given in perfect digits such 1,2,3,… etc).
If two or more rainfall events are equal, then assign same rank to all such events.
Calculate the probability according to any plotting position methods such as Weibul.
Plot the probability vs rainfall on normal probability paper.
Determine the rainfall for 67 % and 75 % from the plotting curves.
Table 27.3 presents average seasonal rainfall and their expected design rainfall at different probabilities.
Table 27.3. Average seasonal rainfall and design rainfall at 67 and 75% probabilities for different locations of India
|
S. No |
Centres |
Average seasonal rainfall, mm |
Probabilities |
|
|
67% |
75% |
|||
|
Low rainfall area: (average annual rainfall : 0-500mm) |
||||
|
1 |
Anantapur |
353.6 |
263 |
224.8 |
|
2 |
Hisar |
345.4 |
299.1 |
238.2 |
|
Medium rainfall area ((average annual rainfall : 500-1000mm) |
||||
|
1 |
Akola |
671.7 |
598.8 |
534.3 |
|
2 |
Anand |
815.5 |
643.1 |
549.5 |
|
3 |
Bangaluru |
523.5 |
408.7 |
388.3 |
|
4 |
Bijapur |
403.9 |
336.6 |
293.3 |
|
5 |
Faizabad |
791.6 |
667.1 |
597.7 |
|
6 |
Kanpur |
714.5 |
639.4 |
611.1 |
|
7 |
Kovilpatti |
145.8 |
109.8 |
86.2 |
|
8 |
Ludhiana |
593.1 |
409.5 |
349.0 |
|
9 |
Parbhani |
834.1 |
618.0 |
545.0 |
|
10 |
Rakhdiansar |
878.4 |
786.4 |
753.0 |
|
11 |
Solapur |
533.0 |
451.8 |
408.5 |
|
12 |
Udaipur |
604.5 |
381.0 |
350.0 |
|
High rainfall areas (average annual rainfall : >1000 mm) |
||||
|
1 |
Bhubaneshwar |
1116.1 |
1042.1 |
959.2 |
|
2 |
Dapoli |
3259.5 |
2962.4 |
2894.3 |
|
3 |
Jabalpur |
1174.5 |
1050.0 |
793.8 |
|
4 |
Jorhat |
1173.3 |
1065.4 |
1034.0 |
|
5 |
Mohanpur |
1050.2 |
881.4 |
865.0 |
|
6 |
Palampur |
1521.3 |
1310.7 |
1222.5 |
|
7 |
Ranchi |
1260.7 |
1040.7 |
990.0 |
|
8 |
Ranichauri |
771.8 |
698.3 |
673.1 |
|
9 |
Raipur |
951.1 |
795.4 |
734.9 |
|
10 |
Samastipur |
993.6 |
830.0 |
798.0 |
(Source Reddy et al., 2012)
Using the design rainfall from Table 27.1, runoff volume for the selected catchment area can be determined using curve number method, which is described earlier.
The further details on dugout farm pond design and construction are provided in the next lesson.
Keywords: Farm pond, design rainfall, probability analysis
Exercise:
Prepare detailed drawing of the embankment using the parameters obtained from solved designed example in this chapter.
Estimate the capacity of farm pond for the following information:
|
Sr No. |
Contour Value |
Area Enclosed (m2) |
|
1 |
150 |
200 |
|
2 |
151 |
250 |
|
3 |
152 |
300 |
|
4 |
153 |
307 |
|
5 |
154 |
405 |
References
-
Reddy, K. S., Kumar M., Rao, K.V., Maruthi, V., Reddy, B.M.K., Umesh B., Ganesh Babu R., Srinivasa Reddy K., Vijayalakshmi and Venkateswarlu, B. (2012). Farm Ponds: A Climate Resilient Technology for Rainfed Agriculture; Planning, Design and Construction. Central Research Institute for Dryland Agriculture, Santoshnagar, Saidabad, Hyderabad- 500059, Andhra Pradesh, India. 60p.
-
Samra, J.S., Sharda, V.N. and Sikka, A.K. (2002). Water Harvesting and Recycling – Indian Experience, CSWCRTI, Dehradun. Pp 29-60.
Internet References
Suggested Reading
-
Murthy, V.V.N. (1994). Land and Water Management Engineering, Kalyani Publishers, New Delhi.
-
Singh, G.,Venkataramanan, C., Sastry, G., and Joshi, B. P. (1990). Manual of soil and water conservation practices. CSWCRTI, Dehradun
-
Sharda, V N, Juyal, G P, Chandra Prakash and Joshi, B. P. (2007). Training Manual-Soil Conservation and Watershed Management (vol 2) Soil and Water Conservation Engineering. CSWCRTI, Dehradun
Last modified: Thursday, 13 March 2014, 7:26 AM