Site pages
Current course
Participants
General
MODULE 1. Systems concept
MODULE 2. Requirements for linear programming prob...
MODULE 3. Mathematical formulation of Linear progr...
MODULE 5. Simplex method, degeneracy and duality i...
MODULE 6. Artificial Variable techniques- Big M Me...
MODULE 7.
MODULE 8.
MODULE 9. Cost analysis
MODULE 10. Transporatation problems
MODULE 11. Assignment problems
MODULE 12. waiting line problems
MODULE 13. Network Scheduling by PERT / CPM
MODULE 14. Resource Analysis in Network Scheduling
LESSON 4. PROGRAMME EVALUATION REVIEW TECHNIQUE: (PERT)
4.1 Introduction:
This technique, unlike CPM, takes into account the uncertainty of project durations into account.
Deterministic network methods assume that the expected time is the actual time taken. Probabilistic methods, on the other hand, assume the reverse, more realistic situation, where activity times are represented by a probability distribution. This probability distribution of activity time is based upon three different time estimate made for each activity. There are as follows .
Optimistic (least) time estimate : (t0 or a) is the duration of any activity when everything goes on very well during the project. i.e., laborers are available and come in time, machines are working properly, money is available whenever needed, there is no scarcity of raw materials needed etc.
Pessimistic (greatest) time estimate: (tp or b) is the duration of any activity when almost every thing goes against our will and a lot of difficulties is faced while doing a project.
Most likely time estimate: (tm or m) is the duration of any activity when sometimes things go on very well, sometimes things go on very bad while doing the project.
4.2 PERT Procedure
-
Draw the project net work
-
Compute the expected duration of each activity te = \[{1 \over 6}\left[ {4{t_m} + {t_0} + {t_p}} \right]\]
-
Compute the expected variance σ \[^2={\left( {{{{t_p} - {t_0}} \over 6}} \right)^2}\] of each activity.
-
Compute the earliest start, earliest finish, latest start, latest finish time for each activity.
-
Determine the critical path and identify critical activities.
-
Compute the expected variance of the Project length (also called the variance of the critical path) σ2 which is the sum of the variances of all the critical activities.
-
Compute the expected standard deviation of the project length and calculate the standard normal derivate \[{{\rm{Z}}_{\rm{0}}}={{{\rm{duedate}} - {\rm{expected date of completion}}} \over {\sqrt {{\rm{project variance}}} }}\]
-
Using (7) one can estimate the probability of completing the project within a specified time, using the normal curve (Area) tables.
4.3 Basic difference between PERT and CPM
PERT
-
PERT was developed in a brand new R and D Project it had to consider and deal with the uncertainties associated with such projects. Thus the project duration is regarded as random variable and therefore probabilities are calculated so as to characterize it.
-
Emphasis is given to important stages of completion of task rather than the activities required to be performed to reach a particular event or task in the analysis of network. i.e., PERT network is essentially an event- oriented network.
-
PERT is usually used for projects in which time estimates are uncertain. Example : R&D activities which are usually non-repetitive.
-
PERT helps in identifying critical areas in a project so that suitable necessary adjustments may be made to meet the scheduled completion date of the project.
Critical Path Method(CPM)
-
CPM was developed for conventional projects like construction project which consists of well know routine tasks whose resource requirement and duration were known with certainty.
-
CPM is suited to establish a trade off for optimum balancing between schedule time and cost of the project.
-
CPM is used for projects involving well know activities of repetitive in nature.
However the distinction between PERT and CPM is mostly historical.
Example:
PERT
The following table lists the jobs of a network with their time estimates.
|
Job I-j |
Duration (days) |
||
|
Optimistic |
Most Likely |
Pessimistic |
|
|
1 2 |
3 |
6 |
15 |
|
1 6 |
2 |
5 |
14 |
|
2 3 |
6 |
12 |
30 |
|
2 4 |
2 |
5 |
8 |
|
3 5 |
5 |
11 |
17 |
|
4 5 |
3 |
6 |
15 |
|
6 7 |
3 |
9 |
27 |
|
5 8 |
1 |
4 |
7 |
|
7 8 |
4 |
19 |
28 |
(a) Draw the project network.
(b) Calculate the length and variance of the critical path.
(c) What the is approximate probability that the jobs on the critical path will be completed by the due date of 42 days?
(d) What due date has about 90% chance of being met?
Solution:
Before proceeding to draw the project network, let us calculate the expected time of activity te, standard deviation and variance of the expected time of activity using
\[{t_e}\,\,\,\,\,\,=\,{{\left( {{t_0}\,\, + \,\,4t{}_m\, + \,{t_p}} \right)} \over 6}\]
\[S.D\,\,=\,\left( {{t_p}\, - \,{t_0}} \right)/6;\,\,\,\,\,\,\,\,\,\,\,Variance\,\,\,\,\,=\,\,{(S.D)^2}\]
|
Activity |
Total Slack |
Free Slack |
Independent Slack |
|
1-2 |
7 |
2 |
4 |
|
1-6 |
6 |
2 |
4 |
|
2-3 |
14 |
4 |
16 |
|
2-4 |
5 |
1 |
1 |
|
3-5 |
11 |
2 |
4 |
|
4-5 |
7 |
2 |
4 |
|
6-7 |
11 |
4 |
16 |
|
5-8 |
4 |
1 |
1 |
|
7-8 |
18 |
4 |
16 |
(a) Project Network:
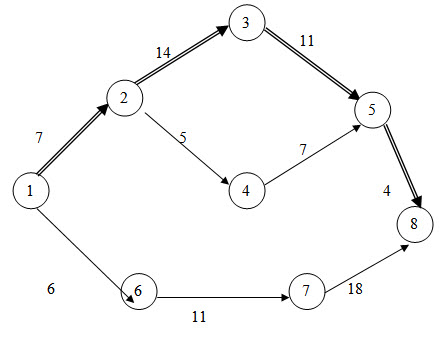
(b) There are three paths:
1-2-3-5-8 = 36 days
1-2-4-5-8 = 23 days
1-6-7-8 = 35 days
1-2-3-5-8 is the longest path and hence the critical path.
Expected length of the critical path is 36 days. The variance for 1-2, 2-3, 3-5 and 5-8 are 4, 16,4 and 1 respectively and variance of the projection duration is 25 and hence
Standard deviation of the project duration = 25 = 5 Days.
(c) Due date = 42 days (T)
Expected duration = 36 days (Te) and S.D = 5 days (0)
Z = (T-Te) / S.D. = (42-36)/5 = 1.2
The area under the normal curve for Z = 1.2 is 0.3849.
Therefore, the probability of completing the project in 42 days
= 0.5000 + 0.3849
= 0.8849
= 88.49%
Last modified: Friday, 4 October 2013, 5:20 AM