Site pages
Current course
Participants
General
Module 1: Formation of Gully and Ravine
Module 2: Hydrological Parameters Related to Soil ...
Module 3: Soil Erosion Processes and Estimation
Module 4: Vegetative and Structural Measures for E...
Keywords
29 March - 4 April
5 April - 11 April
12 April - 18 April
19 April - 25 April
26 April - 2 May
Lesson 14 Runoff Hydrograph - II
14.1 Components of Hydrograph
The essential components of hydrograph are illustrated in fig. 14.1 and described below
(i) Rising limb
(ii) Crest segment
(iii) Recession limb
(i) Rising Limb
The rising limb of hydrograph represents the increase in discharge due to gradual building up of storage in channels over the catchment surface. Its shape depends on the distribution of rainfall intensity, the duration, the antecedent moisture condition of the soil and the translation of runoff from the drainage basin represented by time-area diagram. At the beginning, there is only base flow (i.e., the ground water contribution to the stream) gradually depleting in an exponential form. After the storm commences, the initial loss like interception and infiltration are met and then surface flow begins. However, they occur simultaneously because runoff starts as soon as the top soil gets saturated with water. The hydrograph gradually rises and reaches the first point of inflection where, the slope of the rising limb decreases. The first point of inflection is the point at which discharge consists of flow from all channels and after this peak is possible. As indicated earlier in Lesson 13, the basin and storm characteristics control the shape of the rising limb of the hydrograph.
(ii) Crest Segment
The crest segment is one of the most important parts of a hydrograph as it contains the peak of the hydrograph, which represents the highest concentration of runoff from the watershed. Peak flow occurs after time to peak, which is measured from the point of rise or initiation time of rainfall to the peak flow. The time of peak with respect to initiation time of rainfall varies depending on the distribution pattern of rainfall over the watershed. Generally, the peak occurs after the rain has stopped, but sometimes, when the rainfall is of an advanced type with diminishing rainfall intensity, the peak flow occurs before the end of rainfall. Multiple peaks occur due to the development of multiple storms which are close to each other Fig.14.2). After peak flow, the hydrograph further declines and reaches the second point of inflection, at which slope of the hydrograph further changes, representing the condition of maximum storage or the point at which discharge consists of no direct rain water. This is the last point of crest segment. The second point of inflection is at a distance equal to the time of concentration of the watershed from the end of excess rainfall.
(iii) Recession Limb
The recession limb, which extends from the second point of inflection at the end of crest segment to the commencement of the natural groundwater flow, represents the withdrawal of water from the storage in the basin during the earlier phases of hydrograph. At this time groundwater and the water held in the vadose zone contributes more into the stream flow than at the beginning of the storm. But there after the groundwater table declines and the hydrograph again goes on depleting in the exponential form called ground water depletion curve. The recession limb is independent of storm characteristics and depends entirely on the basin characteristics.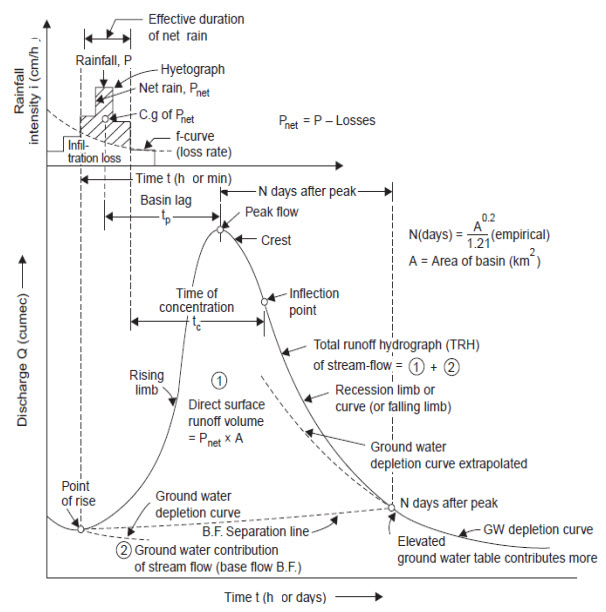
Fig. 14.1. Components of flood hydrograph. (Sources: Raghunath, 2006)
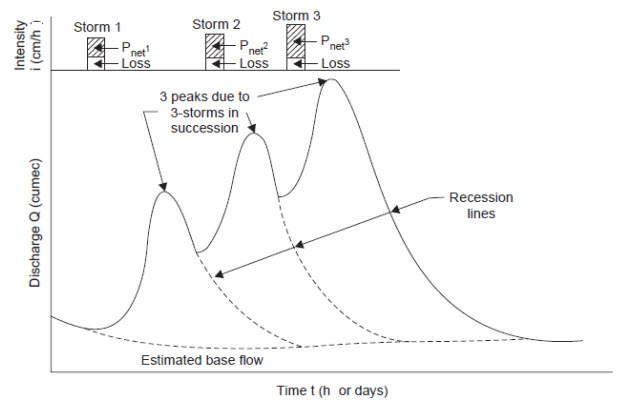
Fig. 14.2. Hydrograph with multiple peaks. (Sources: Raghunath, 2006)
14.2 Baseflow Separation
In many hydrograph analyses a relationship between the surface flow hydrograph and effective rainfall (that is rainfall minus losses) is sought to be established. The surface flow hydrograph is obtained from the total storm hydrograph by separating the quick response flow from the slow response runoff. It is usual to consider the interflow as a part of surface flow in view of its quick response. Thus only the base flow is to be deducted from the total storm hydrograph to obtain surface flow hydrograph. There are four methods of base flow separation that are commonly used. Different methods of base flow separation are illustrated in Fig. 14.3.
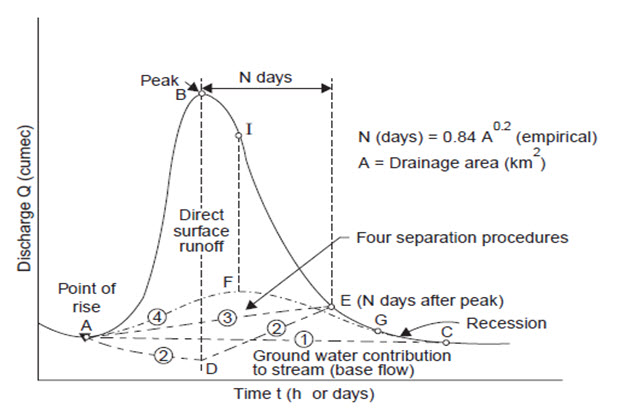
Fig. 14.3. Base flow separation. (Sources: Raghunath, 2006 )
(1) Simply by drawing a line AC tangential to both the limbs at their lower portion. This method is very simple but is approximate and can be used only for preliminary estimates.
(2) Extending the recession curve existing prior to the occurrence of the storm up to the point D directly under the peak of the hydrograph and then drawing a straight line DE, where E is the point on the hydrograph N days after the peak, and N (in days) is given by
N=0.83 A0.2
Where, A= area of the drainage basins (km2)
(3) Simply by drawing a straight line AE, from the point of rise to the point E, on the hydrograph, N days after the peak.
(4) A line AFG is drawn, by projecting the groundwater recession curve after the storm backwards, to a point F directly under the second inflection point of the falling limb and sketch an arbitrary rising line from the point of the rise of the hydrograph to connect with the projected base flow recession. This method of separation is preferred where the ground water storage is relatively large and reaches the stream fairly rapidly, as in lime stone terrains.
In all the above flow separation procedures, the area below the line constructed represents the base flow, which is the ground water contribution to the stream flow.
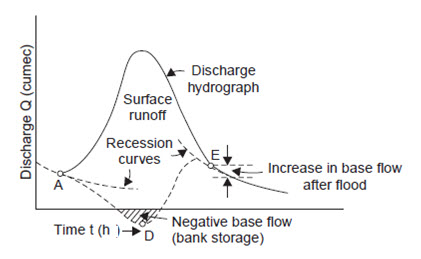
Fig. 14.4. Negative base flow. (Sources: Raghunath, 2006)
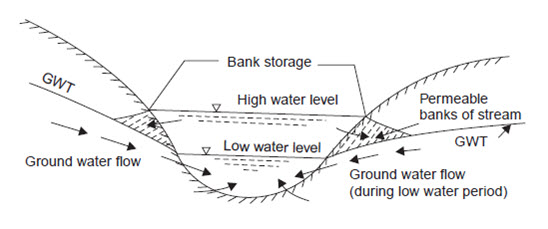
Fig. 14.5. Bank storage. (Sources: Raghunath, 2006)
In Fig. 14.4, ADE is the assumed base flow. Actually when the water level in the stream rises due to floods, the stream feeds the groundwater and the permeable boundaries (called bank storage Fig 14.5) and this is termed as negative base flow (Fig. 14.4).
14.3 Direct Runoff Hydrograph
Effective rainfall is the rainfall minus infiltration and initial losses. The resulting hyetograph is known as effective rainfall hyetograph (ERH). Fig. 14.6 shows the effective rainfall hyetograph. It is also known as hyetograph of rainfall excess or supra rainfall.
The excess rainfall is determined by the infiltration indices (as φ- index and W- index) as the infiltration indices are the average infiltration rate in the hyetograph above which the rainfall is the excess or effective rainfall and the volume of effective rainfall is equal to the surface runoff volume. Direct runoff hydrograph (DRH) is the hydrograph generated due to excess rainfall. The surface runoff hydrograph obtained after the base flow separation is also known as direct runoff hydrograph.
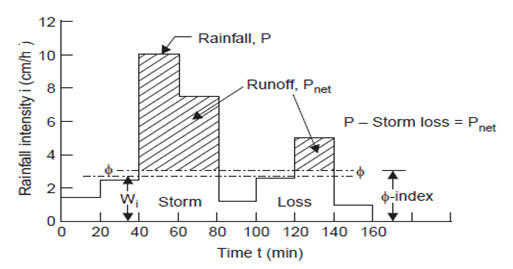
Fig. 14.6. Effective rainfall. (Sources: Raghunath, 2006)
Both ERH and DRH represent the same total quantity but in different units. Since ERH is usually in cm/h plotted against time, the area of ERH multiplied by the catchment area gives the total volume of direct runoff which is the same as area of DRH. Fig. 14.7 shows the direct runoff hydrograph.
Excess rainfall (Pe) = Rainfall (P) – Infiltration
Direct runoff = runoff – base flow
So, Volume of DRH = depth of rainfall excess × area of catchment
Area of DRH = DRH ordinate × time base of DRH
So, volume of DRH = Area of DRH
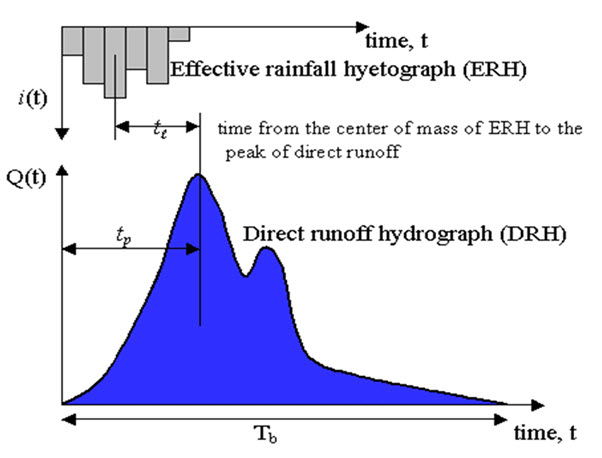
Fig. 14.7. Direct runoff hydrograph. (Sources: https: //www. rslabntu.net)
Where, tp = time to peak flow from point of rising, Tb = base of hydrograph
Last modified: Monday, 23 September 2013, 4:41 AM