Site pages
Current course
Participants
General
Module 1: Formation of Gully and Ravine
Module 2: Hydrological Parameters Related to Soil ...
Module 3: Soil Erosion Processes and Estimation
Module 4: Vegetative and Structural Measures for E...
Keywords
Lesson 7 Measurement of Precipitation
The term precipitation denotes all forms of water that reach the earth from the atmosphere. The usual forms are rainfall, snow fall, hail, frost and dew. Rainfall is the predominant form of precipitation causing stream flow in a majority of rivers in India. However, many rivers in the northern India acquire their flow from snowmelt also, besides rainfall. The magnitude of precipitation varies with time and space.
7.1 Characteristics of Precipitation in India
India experiences a monsoon climate with two major and two transitional periods of rainfall. These are caused by monsoon winds generated at different times and moving inland from the Arabian Sea in the west and the Bay of Bengal in the east.
(i) South-West Monsoon (June–Sep)
The south-west monsoon is popularly known as monsoon. It is the principal rainy season of India, when 75% of annual rainfall is received over a major portion of the country, except south-eastern part and Jammu & Kashmir. The heavy rainfall areas are:
Assam and north eastern region (200-400 cm)
West coast and Western Ghats (200-300 cm)
West Bengal (120-160 cm)
UP, Haryana and Punjab (100-120 cm)
(ii)Transition I, Post-Monsoon (Oct-Nov)
In this period rainfall occurs in the south eastern part (Tamil Nadu), often accompanied by cyclonic storms coming from over Bay of Bangal, that also affect the neighbouring state of Andhra Pradesh.
(iii)Winter Season (Dec-Feb)
In this period moderate to heavy rainfall and snowfall (25 cm) occurs in the Himalayas and Jammu & Kashmir. The areal spread of winter rain is experienced over many regions in north India but with reduced quantity. The rainfall in India during the non-monsoon seasons (particularly, winter) is also augmented by ‘Western Disturbances’, which normally refers to the movement of water vapour laden air from the Mediterranean sea towards east. Winter rain is useful for the winter season (Rabi season) crops in meeting a part of their water requirement.
(iv) Transition II, Summer (March-May)
There is very little rainfall in India in this season.
Annual Rainfall
Considerable areal variation exists in the annual rainfall in India with high rainfall of the magnitude 200cm in Assam and north-eastern parts and the Western Ghats, and scanty rainfall in eastern Rajasthan and parts of Gujarat, Maharashtra and Karnataka. The average annual rainfall for the entire country is estimated as 119 cm.
7.2 Raingauge
Raingauge measures the depth and intensity of rainfall.
Types of Raingauge:
(a) Non-recording
(b) Recording
(a) Non-Recording Type Raingauges:
There are two types of non-recording raingauges
(i) Symon’s gauge.
(ii) Standard raingauge
(i) Symon’s Gauge
The non-recording type rain gauge commonly used in India is the Symon’s gauge.

Fig. 7.1. Symon’s gauge. (Source: (a): http://www.gb-international.com/product/1052.jpg, (b):http://static7.theconstructor.org/wpcontent/uploads/2010/10/image1.png)
It consists of a circular collecting area of 127 mm diameter which is connected to a funnel. The rim of the collector is set at a height of 30.5 cm above the ground level. The funnel discharges the rainfall into a receiving vessel. The funnel and receiving vessels are housed in a metallic container. The receiving bottle normally holds a maximum of 10 cm of rain and in case of heavy rainfall the measurement must be done frequently. Last reading must be taken at 8.30 AM and the sum of the previous readings in the past 24 hours entered as the total rainfall of the day.
(ii) Standard Raingauge
This is a basic storage device that measures the cumulative amount of rain. A common type of these gauges is called the 8-inch Standard Rain Gauge (SRG), which has been used by the weather offices of US National Weather Service (NWS) for over 100 years. The standard gauge is simply a large cylinder with a funnel and a plastic measuring tube inside the cylinder.
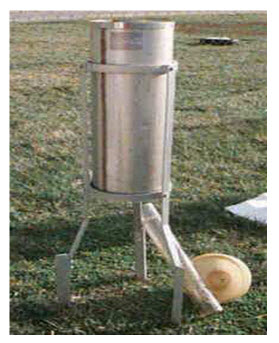
Fig. 7.2. The national weather service standard rain gauge, SRG. (Source: http://www.srh.noaa.gov/tlh/cpm/srg_page.html)
(b) Recording Raingauges
Recording gauges produce a continuous plot of rainfall against time and provide valuable data of intensity and duration of rainfall for hydrological analysis of storms. The following are some of the commonly used recording raingauges.
(i) Tipping –bucket Type
(ii)Weighing –bucket Type
(iii) Natural syphon or float Type
(iv) Optical raingauges
(i)Tipping–bucket Type
This type of raingauges is adopted by the US Weather Bureau.
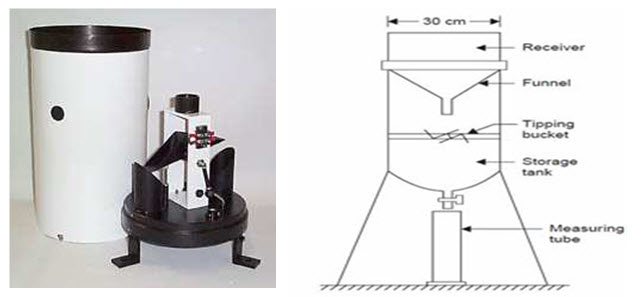
Fig.7.3. Tipping bucket Type raingauge. (Source: (a) NovaLynx corporation, (b) http://www.engineeringsall.com/www.engineeringsall.com/images/featured/Tipping-Bucket-Type-Rain-Gauge.jpg)
The rainfall collected in the funnel falls in one of a pair of small buckets. The buckets are so adjusted that when 0.25 mm of rainfall collects in one bucket, it tips and brings the other one in position. The water from the tipping bucket is collected in a storage can. The tipping bucket consists of a mechanically or electrically driven pen to trace the record on the clockwork driven chart. It gives intensity of rainfall. Tipping buckets tend to underestimate the amount of rainfall, particularly in snowfall and heavy rainfall events. The advantage of the tipping bucket rain gauge is that the character of the rain (light, medium or heavy) may be easily obtained. Rainfall character is decided by the total amount of rain that falls in a set period (usually 1 hour) and by counting the number of 'clicks' in a 10 minute period the observer can decide the character of the rain. Correction algorithms can be applied to the data as an accepted method of correcting the data for high level rainfall intensity amounts.
(ii)Weighing –bucket Type
In this type of raingauge the catch from the funnel empties into a bucket mounted on a weighing scale and the weight of the bucket and its contents are recorded on a clock-driven chart. It gives the plot of accumulated rainfall against the elapsed time that is mass curve of rainfall.

Fig. 7.4. Weighing bucket type raingauge. (Source: www.ametsoc.org)
The advantages of this type of gauge over tipping buckets are that it does not underestimate intense rain, and it can measure other forms of precipitation, including rain, hail and snow. These gauges are, however, more expensive and require more maintenance than tipping bucket gauges.
(iii) Natural syphon or float type
This type of raingauge is adopted as a standard recording type raingauge in India. Here the rainfall collected by a funnel shaped collector is led into a float chamber causing the float to rise. As the float rises, a pen attached to the float records the elevation of the float on a rotating drum driven by clock-work mechanism. A syphon arrangement empties the float chamber when the float has reached a pre-set maximum level. It gives a plot of mass curve of rainfall.
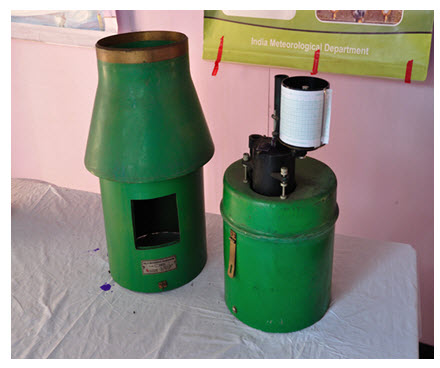
Fig. 7.5. Natural syphon or float type raingauge. (Source: http://upload.wikimedia.org/wikipedia/commons/5/56/Dismantled_Self_Recording_Rain_Gauge_-_Kolkata_2012-01-23_8704.JPG)
(iv) Optical Raingauges
This is a relatively new technology that is based on measuring rainfall rate as proportional to the disturbance by raindrops to an optical beam between a light source and an optical receiver. This type of rain gauge is relatively expensive and has mainly been used for research purposes.
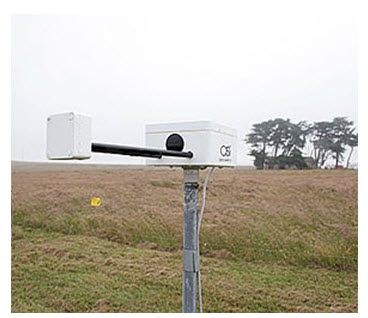
Fig. 7.6. Optical raingauge. (Source: www.arm.gov)
7.3 Radar Measurement of Rainfall
The meteorological radar is a powerful instrument for measuring the areal extent, location and movement of rain storms. Further, the amount of rainfall over large areas can be determined through the radar with a good degree of accuracy.
Radar measurement of rainfall is based on the principle of reflection of energy. Radio-waves in the “microwave frequencies” are reflected by solid or liquid particles (hydrometeors) in the atmosphere and are determined by electromagnetic energy of radar pulses. The result is displayed on an oscilloscope screen giving the range (distance) and direction (bearing) of the objects being observed. The brightness of the echo image (reflectance) on the screen is related to the number of raindrops, hail or snowflakes falling. Reflectance is used to evaluate the intensity of precipitation as distributed in space and time over the area scanned by the radar.
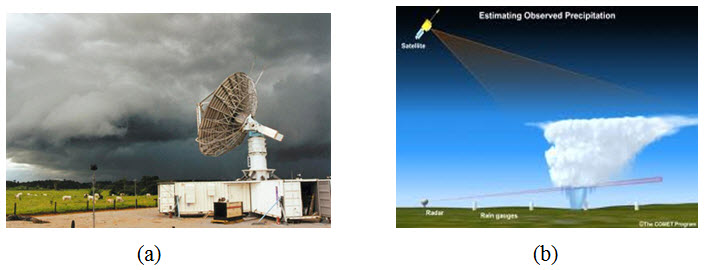
Fig. 7.7. Radar measurement of rainfall. (Source: (a) www2.ucar.edu, (b) www.meted.ucar.edu)
Range of weather radar is approximately 350 km. Indian meteorological department (IMD) is currently operating a network of 40 radars.
7.4 Raingauge Network
Two types of error occur in rainfall measurement, namely random and systemic. Random errors are due to storm characteristics, raingauge density and ability of a raingauge to represent the area that it is supposed to represent. Systematic errors are due to measurement errors, improper siting, poor exposure, change in observer and change in gauge.
In general, the sampling errors of rainfall tend to increase with increasing mean areal rainfall and decrease with increasing network density, duration of rainfall, and areal extent. Accordingly, larger average errors are produced by a particular network for storm rainfall than for monthly, seasonal or annual rainfall. The adequacy of an existing raingauge network of a watershed is assessed statistically.
The optimum number of raingauges corresponding to an assigned percentage of error in estimation of mean areal rainfall can be obtained as
N = (Cv/ɛ)
Where,
N = optimum number of raingauge.
CV = coefficient of variation of the rainfall values of the gauges.
ɛ = assigned percentage of error in estimation of mean areal rainfall (usually 10 %).
(1) World Meteorological Organization (WMO) Recommended Precipitation Network Density
One station per 600 to 900 km2 - in flat regions of temperate, Mediterranean and tropical zone.
One station per 100 to 250 km2 – in mountainous regions of temperate, Mediterranean and tropical zone.
One station per 25 km2 – in small mountainous land with irregular precipitation.
One station per 1500 to 10,000 km2 – arid and polar zones.
(2) Indian Standard Recommendation
One station per 520 km2 - in plains.
One station per 260 - 390 km2 – in regions of average elevation of 1000 m.
One station per 130 km2 – in predominantly hilly areas with heavy rainfall.
Last modified: Thursday, 19 September 2013, 11:51 AM