Site pages
Current course
Participants
General
Module 1: Formation of Gully and Ravine
Module 2: Hydrological Parameters Related to Soil ...
Module 3: Soil Erosion Processes and Estimation
Module 4: Vegetative and Structural Measures for E...
Keywords
Lesson 15 Unit Hydrograph - I
15.1 Unit Hydrograph Concept
The problem of predicting the flood hydrograph resulting from a known storm in a catchment, for which the flood hydrograph could not be recorded, has received considerable attention. For example, flood hydrograph may be needed for the ‘design’ storm, which may be the 10-year 4-h storm. Such storms are found from the analysis of rainfall data that are huge in volume. On the other hand, recorded hydrographs are always much fewer in number. A large number of methods are proposed to solve this problem and of them probably the most popular and widely used method is the unit-hydrograph method.
15.1.1 Unit Hydrograph
A unit hydrograph is defined (Subramanya, 1994) as the hydrograph of direct runoff resulting from one unit depth (1 cm) of rainfall excess occurring uniformly over the basin and at a uniform rate for a specified duration (D hours).
The definition of unit hydrograph implies the following:
The unit hydrograph represents the lumped response of the catchment to a unit rainfall excess of D-hour duration to produce a direct runoff hydrograph. It relates only the direct runoff to the rainfall excess. Hence, the volume of water contained in the unit hydrograph must be equal to the rainfall excess. As 1 cm depth of rainfall excess is considered the area of the unit hydrograph is equal to a volume given by 1 cm over the catchment.
The rainfall is considered to have an average intensity of excess rainfall of 1/D cm/h for the duration of D-h of the storm.
The distribution of the storm is considered to be uniform over the entire catchment.
15.1.2 Elements of Unit Hydrograph
The various elements of a unit hydrograph are shown in Fig.15.1
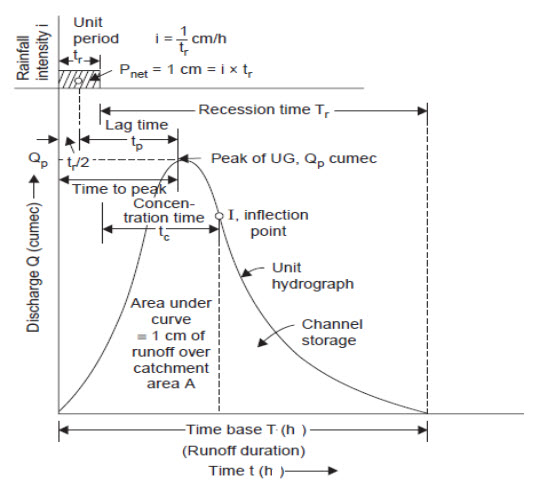
Fig. 15.1. Elements of unit hydrograph. (Sources: Raghunath, 2006)
(a) Base width (T): The period of direct surface runoff (due to a unit storm) of the unit hydrograph is called the time base or the base width.
(b) Unit storm: The storm of unit duration (i.e., duration of the unit hydrograph) regardless of its intensity is called unit storm.
(c) Unit period: The time duration of the unit storm (i.e., the duration of the unit hydrograph) is called unit period.
(d) Lag time (tp): The time from the center of a unit storm to the peak discharge of the corresponding unit hydrograph is called lag time.
(e) Recession time (Tr): The duration of the direct surface runoff after the end of the excess or net rainfall, is called recession time in hydrograph analysis.
15.1.3 Assumptions of Unit Hydrograph
The following are the basic assumptions of the unit hydrograph:
1. Same Runoff Duration
For all unit storms of different intensities, the period of surface runoff (i.e., time base, base width or base period) is approximately the same, although they produce different runoff volumes (Fig. 15.2).
2. Proportional Ordinates
For unit storms of different intensities, the ordinates of the hydrograph at any given time are in the same proportion as the rainfall intensities (Fig. 15.2).
3. Principle of Superposition
If there is a continuous storm and/or isolated storms of uniform intensity net rain, they may be divided into unit storms and hydrographs of runoff for each storm obtained, and the ordinates added with the appropriate time lag to get the combined hydrograph (Fig. 15.3).\
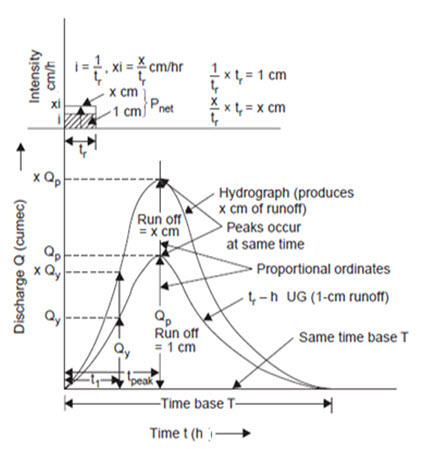
Fig. 15.2. Proportional ordinates and same time base. (Sources: Raghunath, 2006)
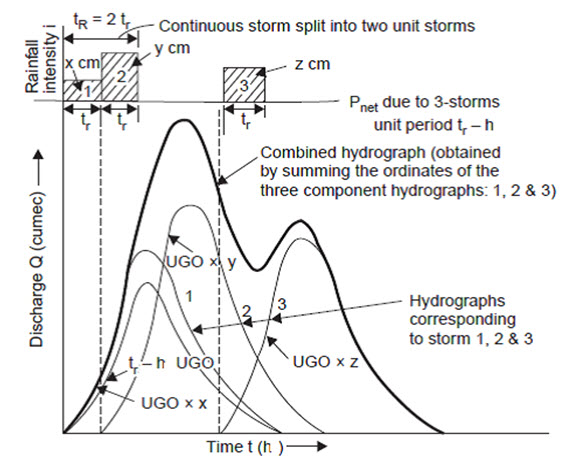
Fig. 15.3. Principle of superposition. (Sources: Raghunath, 2006)
4. Same Distribution Percentages
If the total period of surface runoff (i.e., time base or base width) is divided into equal time intervals the percentage of surface runoff that occurs during each of these periods will be the same for all unit storms of different intensities (Fig. 15.4).
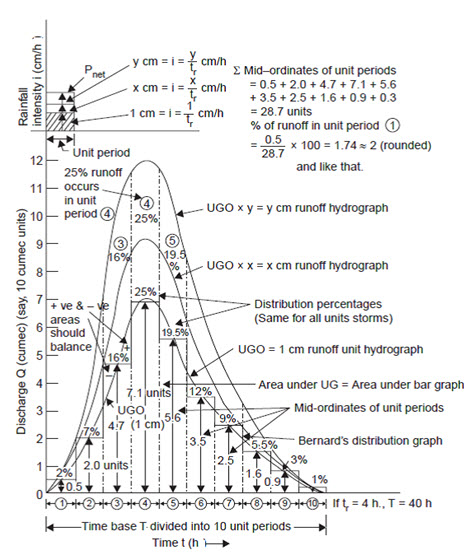
Fig. 15.4. Distribution percentage same for all unit storm. (Sources: Raghunath, 2006)
15.1.4 Derivation of the Unit Hydrograph
From the historical record, the mean daily stream flow data from a drainage basin is given below:
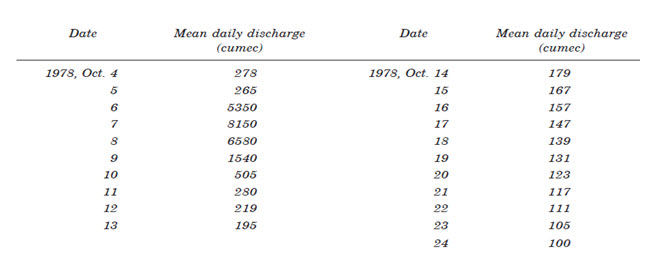
The following steps are adopted to derive a unit hydrograph from an observed flood hydrograph (Fig. 15.5).
Step1: Select from the records of isolated (single-peaked) intense storms, which had occurred uniformly over the catchment and produced flood hydrographs with appreciable runoff (>1cm, say, 8 to 16 cm). The unit period selected should be such that the excess rainfall (i.e., Pnet) occurs fairly uniformly over the entire drainage basin. Larger unit periods are required for larger basins. The unit periods may be in the range of 15-30% of the ‘peak time’ period, i.e., the time from the beginning of surface runoff to the peak, and the typical unit periods may be 3, 6, 8, 12 hours. The time of concentration may be a little longer than the peak time. The unit storm is a storm of such duration that the period of surface runoff is not much lesser for any other storm of shorter duration.
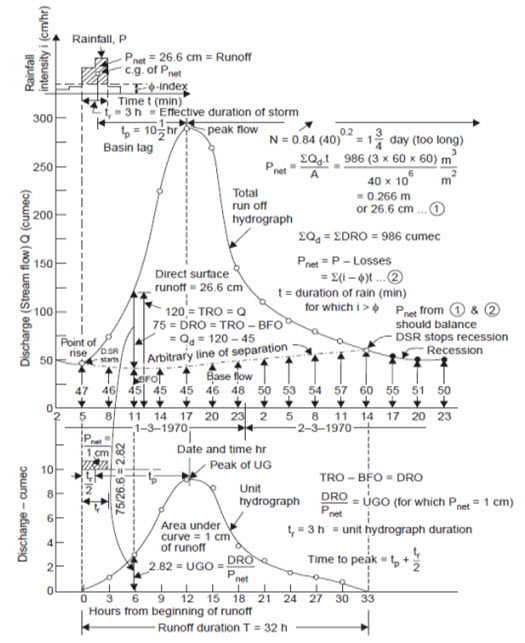
Fig. 15.5. Derivation of a unit hydrograph. (Sources: Raghunath, 2006)
Step 2: Select a flood hydrograph, which has resulted from a unit storm chosen in step (1) above.
Step 3: Separate the base flow from the total runoff (by the well-known base flow separation procedures).
Step 4: From the total runoff hydrograph ordinate (TRO) (at regular time intervals) deduct the corresponding base flow ordinate (BFO), to obtain the direct runoff ordinate (DRO).
Step 5: Divide the volume of direct runoff by the area of the drainage basin to obtain the net precipitation depth over the basin.
Step 6: Divide each direct runoff ordinate (DRO) by the net precipitation depth to obtain the unit hydrograph ordinate (UGO).
Step 7: Plot the unit hydrograph ordinate (UGO) against time since the beginning of direct runoff. This will give the unit hydrograph for the basin, for the duration of the unit storm (producing the flood hydrograph) selected in step (1) above.
In unit hydrograph derivation, such storms should be selected for which reliable rainfall and runoff data are available. The net rain graph (hyetograph of excess rain) should be determined by deducting the storm loss and adjusting such that the total volume of net storm rain is equal to the total volume of direct surface runoff. The unit hydrograph derived, which, when applied to the known net rain data, should yield the corresponding direct runoff hydrograph.
In many countries and regions and particularly for small agricultural catchments, flood hydrographs are not recorded and hence, the corresponding unit hydrographs cannot be derived. However, hydrologists have opined that a hydrograph derived for a given catchment may be applied to hydrologically similar catchments.
15.1.5 Alteration of Unit Hydrograph Duration
For the same catchment area, unit hydrographs of different durations may be required to match with the ‘design’ storm for a given purpose. For example, for designing a surface drainage system for a small agricultural catchment, the design storm may be the 5-year 1-h storm whereas for designing a drop spillway, it may be the 10-year 2 h storm. Usually, the return period and the duration of design storm are small when the losses involved if the designed system fails are also small. When the expected losses are more or of a serious nature (loss of cattle or human lives, damage to property), the return period and the duration are higher. For a hydrologically similar catchment of area different than the one for which the unit hydrograph has been derived, the time of concentration will differ. This will require the selection of the appropriate duration design storm. There are two methods for alteration of unit hydrograph duration
(1) Method of Superposition
If the desired long duration of the unit graph is an even multiple of the short, say a 3-hour unit graph is given and a 6-hour unit graph is required. Assume two consecutive unit storms, producing a net rainfall of 1 cm each. Draw the two unit hydrographs, the second unit graph being lagged by 3 hours. Draw now the combined hydrograph by superposition. This combined hydrograph will now produce 2 cm in 6 hours. To obtain the 6-hour unit graph divide the ordinates of the combined hydrograph by 2, Fig. 15.6. It can be observed that this 6-hour unit graph derived has a longer time base by 3 hours than the 3-hour unit graph, because of a lower intensity storm for a longer time.
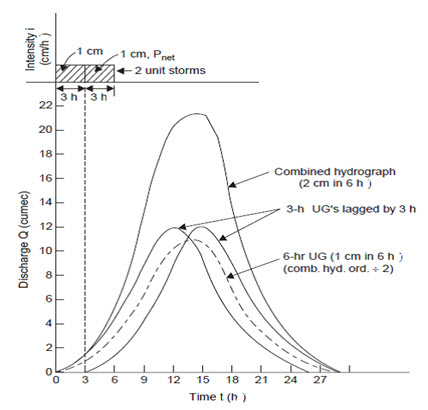
Fig. 15.6. Method of Superposition. (Sources: Raghunath. H.M., 2006)
(2) S-curve Technique
S-curve or the summation curve is the hydrograph of direct surface discharge that would result from a continuous succession of unit storms producing 1 cm in tr–hour. (Fig.15.7). If the time base of the unit hydrograph is T hour, it reaches constant outflow (Qe) at T hours, since 1 cm of net rain on the catchment is being supplied and removed every tr hour and only T/tr unit graphs are necessary to produce an S-curve and develop constant outflow given by

Where, Qe = constant outflow (cumec), tr = duration of unit graph (hour), A= area of the basin (km2)
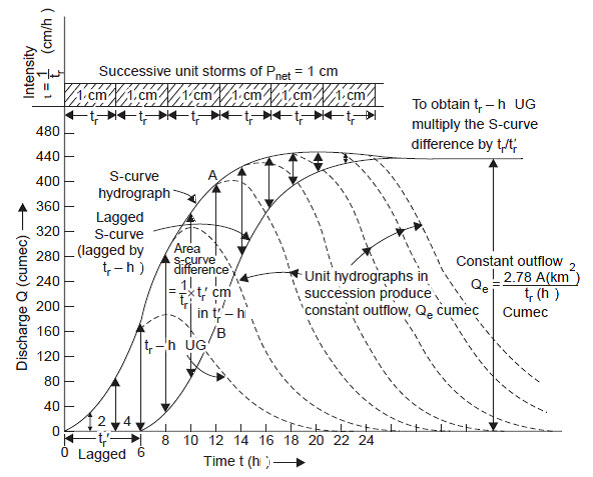
Fig. 15.7. S-curve technique. (Sources: Raghunath. H.M., 2006)
Given a tr-hour unit graph, to derive a tr′-hour unit graph (tr′ ≥ tr)—Shift the S-curve by the required duration tr′ along the time axis. The graphical difference between the ordinates of the two S-curves, i.e., the shaded area in Fig. 15.7 represents the runoff due to tr′ hours rain at an intensity of 1/tr cm/hr, i.e., runoff of tr′/tr cm in tr′ hours. To obtain a runoff of 1 cm in tr′ hours (i.e., tr′-hour UG), multiply the ordinates of the S-curve difference by tr/tr′. This technique may be used to alter the duration of the given unit hydrograph to a shorter or longer duration. The longer duration need not necessarily be a multiple of short.
15.2 Use and Limitation of Unit Hydrograph
As unit hydrographs establish a relationship between the ERH and DRH for a catchment, they are of immense value in the study of hydrology of a catchment.
They have wider use in
(i) Development of flood hydrograph for extreme rainfall magnitudes for the use in the design of the hydraulic structures.
(ii) Extension of flood flow records based on rainfall records.
(iii) Development of flood forecasting and warning system based on rainfall.
However, there are some limitations in the use of unit hydrograph as:
(i) Unit hydrograph is applicable for catchment area between 2 km2 to5000 km2
(ii) Precipitation must be from rainfall only. Snow-melt runoff cannot be satisfactorily represented by unit hydrograph.
(iii) The catchment should not have large storage in terms of tanks, ponds, large flood-bank storage, which effect the linear relationship between storage and discharge,
(iv) If the precipitation is non-uniform, unit hydrographs cannot be expected to give good results.