Site pages
Current course
Participants
General
MODULE 1. Introduction to mechanics of tillage tools
MODULE 2. Engineering properties of soil, principl...
MODULE 3. Design of tillage tools, principles of s...
MODULE 4. Deign equation, Force analysis
MODULE 5. Application of dimensional analysis in s...
Module 6. Introduction to traction and mechanics, ...
Module 7. Traction model, traction improvement, tr...
Module 8.Soil compaction and plant growth, variabi...
LESSON 22. TRACTION IMPROVEMENT AND TRACTION PREDICTION
22.1. TRACKS
Tracks have been used for many years to reduce soil pressure and to increase traction on soft, loose soil surfaces that have low strength. Tracks result in the best relative performance as compared with pneumatic tires when the tractor is operating at nearly maximum drawbar pull on soft, loose soil surfaces.
22.2. TRACTION IMPROVEMENT
For certain soil conditions, traction aids are helpful. Table 1.1 shows the relative improvement of three traction aids. Strakes and halftracks are more commonly used in Europe. Table 1.2 shows the relative effect of adding weight and increasing the contact area (larger tires). Tractors with both rubber tires and wheel extensions (strakes) are commonly used on weak surfaces such as rice paddy soils.
Rubber traction tires, as compared to steel traction wheels, have greatly improved the tractive efficiency, the maneuverability, and the comfort of farm tractors. Except on very firm soils, however, rubber tires have not increased the traction. In fact, under some conditions, such as when the surface of the soil is very wet and slick or when the soil is covered with a thick cover crop, the traction of rubber tractor tires is poor.
Table 2 .1. Relative Improvement in Traction from Chains, Strakes, and Half-tracks on 13.6-28 (345-711 mm) Tires
|
Traction Aid
|
Pull at 15% Slip |
||||
|
Sandy Loam: Cultivated, Loose, and Dry |
Medium Loam: Cultivated and Damp |
Medium Loam: Wet Green Grain Stubble |
Medium Loam: Alfalfa Sod and Frozen Crust |
Heavy Clay: Sparse Hay Aftermath |
|
|
Air-filled tires only |
1.00 |
1.00 |
1.00 |
1.00 |
1.00 |
|
Air-filled tires plus: |
|||||
|
Chains |
0.92 |
1.06 |
1.09 |
1.00 |
1.09 |
|
Strakes |
1.51 |
1.56 |
1.78 |
1.76 |
2.86 |
|
Half-tracks |
1.80 |
2.38 |
2.00 |
2.30 |
2.36 |
Table 2.2. Relative improvement in traction performance of larger, dual and solution – filled tires
|
Tire and Arrangement |
Pull at 15% Slip |
||||
|
Sandy Loam: Cultivated, Loose, and Dry |
Medium Loam: Cultivated and Damp |
Medium Loam: Wet Green Grain Stubble |
Medium Loam: Alfalfa Sod and Frozen Crust |
Heavy Clay: Sparse Hay After- Math |
|
|
Air filled (13.6-28) |
1.00 |
1.00 |
1.00 |
1.00 |
1.00 |
|
Air-filled dual (13.6-28) |
1.05 |
— |
1.24 |
1.35 |
1.41 |
|
Large air filled (14.9-28) |
0.97 |
1.27 |
1.06 |
1.05 |
1.14 |
|
Solution filled (13.6-28) |
1,61 |
1.59 |
1.35 |
1.60 |
1.52 |
|
Solution- filled dual (13.6-28) |
2.36 |
2.75 |
2.15 |
2.54 |
2.28 |
When traction conditions are good, the largest improvement in traction can be made by simply adding more weight to the tractor drive wheel. However, when the surface soil is very wet the internal friction, , approaches zero, and therefore an increase in the soil pressure will not increase traction significantly unless the traction device can "cut through" the low friction surface layer.
22.3. TRACTION PREDICTION FROM DIMENSIONAL ANALYSIS
22.3.1. EQUATION DEVELOPMENT
Dimensional analysis is used to simplify the prediction equations for the multivariable system. The variables considered in the following prediction equations are presented in Table 2.3.
As shown, nine pertinent variables are involved in the traction equations. Seven dimensionless ratios are needed to formulate a prediction equation. An adequate set of dimensionless ratios relating the variables is
 ---------- (2.1)
However, since µ = µg – ρ, experimental relations only need be developed for ρ and µg.
Table 2.3. Wheel soil model parameters
|
Parameter |
Symbol |
Dimensions |
|
Soil: Cone index Wheel: Tire section width Overall tire diameter Tire rolling radius System: Load Towed force Pull Gross tractive force Slip |
CI
b d r
W TF H F S |
FL-2
L L L
F F F F — |
i. Towed Force: The towed force or motion resistance of a pneumatic tire is dependent on load, size, and inflation pressure, as well as soil strength. For soils that are not very soft and tires that are operated at nominal tire inflation pressures, the towed force can be predicted from
![]() ---------------------------------------- (2.2)
---------------------------------------- (2.2)
Cn = wheel numeric =  -------------------------------- (2.3)
(Dimensions must be selected such that the wheel numeric is dimensionless.)
CI = cone index measured with a cone penetrometer as in ASAE R 313.1
It should be noted that for a firm surface such as compacted dry clay, the Cn value would be very large and the towed force would be equal to 0.04 times the wheel load. This rolling resistance is attributed to tire flexing and scrubbing. Equation 2.3 was developed for tires with a tire width/diameter, b/d ratio of approximately 0.3. Any large deviation from this width/diameter ratio can be expected to change the quantitative relation of the towed force function. The towed force number defined by equation 2.3 is presented graphically in Fig. 2.1.
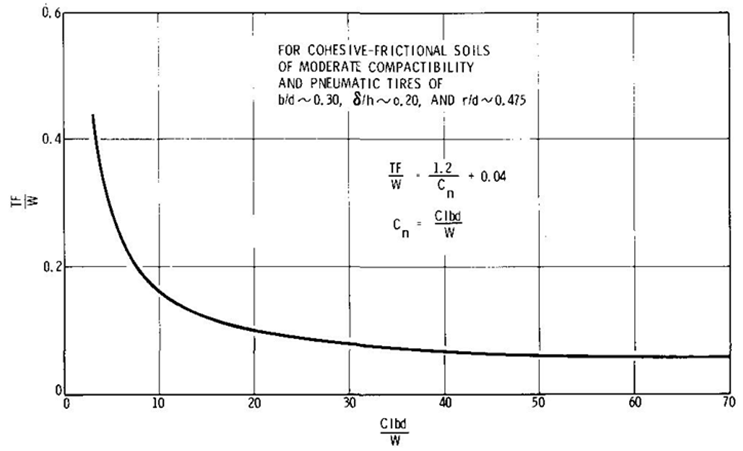
Fig. 2.1. Towed wheel performance relation (Wismer and Luth, 1974)
ii. Gross Tractive Force: The variations of the gross tractive force with soil strength and slip have been incorporated into a relation including the effect of wheel load and tire size:
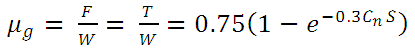 --------------------- (2.4)
Where, e = base of natural logarithms.
iii. Pull: Substituting equations 2.3 and 2.4 into equation 2.4 in module VI, the net traction coefficient µ is given by
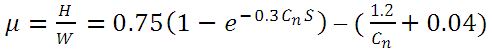 -------------- (2.5)
A practical restriction of b/d 0.30 is imposed on the final equation along with a tire deflection/section height ratio (/h) limitation of 0.20. The restriction on d/h is associated with an r/d 0.475. This reduces the pull relation to one dependent (H/W) and two independent (Cn and S) dimensionless ratios resulting in equation 2.5, which is presented graphically in figure 2.2. Prediction equations 2.2, 2.4 and 2.5 give good estimates of the performance of a single tire except where the surface of the soil is weak. However, the effect of tread differences cannot be predicted with the equations.
iv. Tractive Efficiency: The pull, torque and slip characteristics of a driving wheel define both the magnitude and efficiency of tractive performance. The pull/weight ratio or net tractive coefficient is an accepted term for defining performance level. Similarly, the term tractive efficiency (TE) has been adopted to define efficiency. Tractive efficiency of a wheel is defined as:
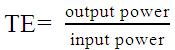 -------------------------------------------- (2.6)
Which can be expressed as,
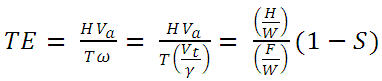 ---------------------- (2.7)
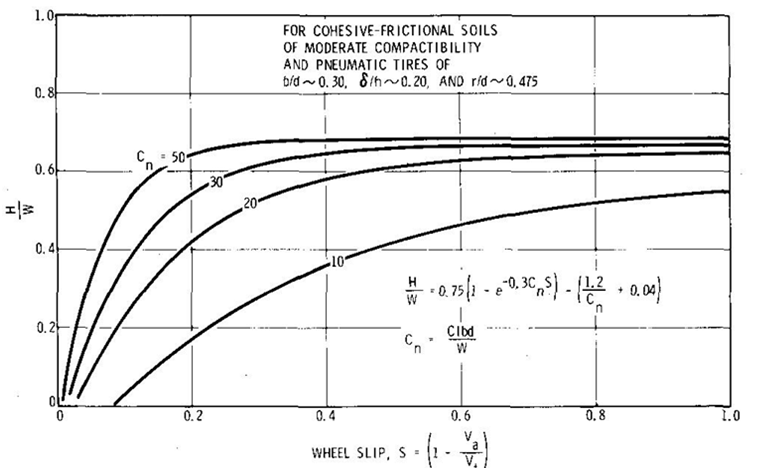
Fig. 2.2. Driving wheel prediction relation (Wismer and Luth, 1974)
The variation of tractive efficiency and the pull/weight (H/W) ratio of a driving wheel with slip is shown in figure 2.3. It is readily observable that TE reaches a maximum at a relatively low slip and then decreases with increasing slip. Also note that the maximum TE occurs at lower slip values for the large Cn values that are associated with higher soil strengths or lower wheel loadings. Maximum power output of a wheel occurs at the wheel slip of maximum TE. However, the H/W ratio is not close to its maximum value at this slip. The requirement for a large drawbar pull necessitates that the design slip be selected to the right of the slip corresponding to the peak of the TE curve. A typical design TE curve is shown in figure 2.3. From this curve the design TE, H/W, and slip for a variety of soil strengths and wheel loading combinations, in terms of Cn, can be determined: for example, for Cn = 30, TE = 0.72, H/W = 0.51, slip = 0.16. This approach permits balancing the design of the vehicle over the range of soil strengths it will probably encounter in its operational life.
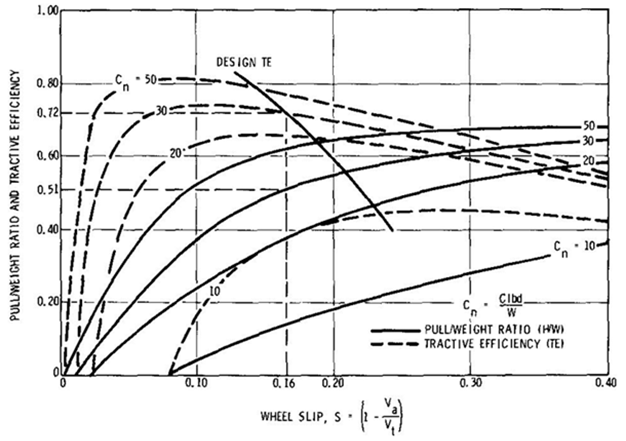
Fig. 2.3. Tractive performance of wheels on soil (Wismer and Luth, 1974)
Last modified: Wednesday, 19 March 2014, 12:35 PM