Site pages
Current course
Participants
General
MODULE 1. Introduction to mechanics of tillage tools
MODULE 2. Engineering properties of soil, principl...
MODULE 3. Design of tillage tools, principles of s...
MODULE 4. Deign equation, Force analysis
MODULE 5. Application of dimensional analysis in s...
Module 6. Introduction to traction and mechanics, ...
Module 7. Traction model, traction improvement, tr...
Module 8.Soil compaction and plant growth, variabi...
LESSON 25. TIRE TERMINOLOGY AND SELECTION OF TIRES
25.1. TIRE TERMINOLOGY
The prefix R has been adopted by ASAE (1983) as the code for rear, or drive, tires. The prefixes F and I have been adopted for steering tires (or front tires) and for implement tires, respectively. The "regular" agricultural drive tire is coded R-1. There are three other categories of drive tire: cane and rice (R-2), industrial and sand (R-3), and industrial tractors (R-4). Front or steering tires are coded F-l for single-rib tires, F-2 for "regular" agricultural tires, and F-3 for industrial multiple-rib tires. Implement tires are coded 1-1 for ribbed, 1-2 for moderate traction, 1-3 for traction, and 1-6 for smooth implement tires.
Tire sizing is based on the tire section width and the rim diameter. Thus a 18.4-26 drive tires has a section width of 18.4 in. and a rim diameter of 26 in. Early tire designs had tire section widths equal to the tire section height. The aspect ratio of these tires, as defined by h(b, where h is the tire section height and b the tire section width, was thus equal to 1.0, The length of the contact patch is given by
l ≈ 0.31d -------------------------------------------- (4.1)
where / is the length of the contact patch and d the diameter of the unloaded tire. The contact patch can be regarded as elliptical in shape, and the cross-sectional area of the patch is given by
A = πlb ---------------------------------------------- (4.2)
where b is the width of the contact patch.
Today's tires have wider section widths, and aspect ratios of 0.85 or even 0.75 are found (Inns and Kilgour, 1978).
The ply rating of a tire is used to indicate its load-carrying ability. The ply rating was once used to specify the number of plies built into the construction of the tire. This is no longer the case, but the term has been retained as an index of the tire strength. There are three types of casing construction: cross ply, radial ply, and belted bias (Anslow and Warrilow, 1970). In the case of cross-ply construction, the cords are arranged at an angle of approximately 40° to the circumferential centerline of the tire. This is referred to as the crown angle (Wong, 1978). There are normally two or more layers or cords, or plies, each layer being set in the opposite bias. The majority of agricultural tires are of this construction.
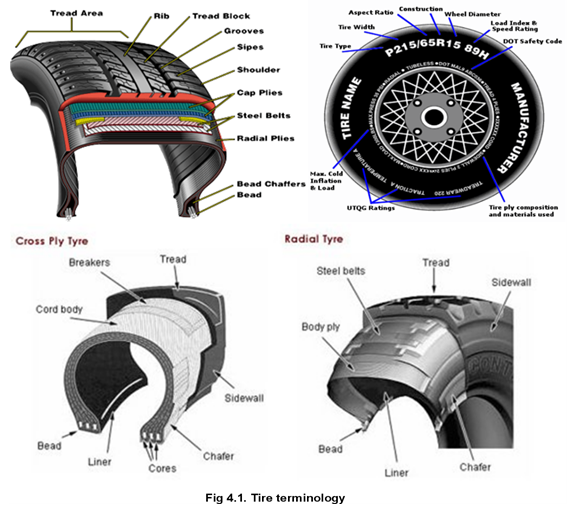
The advantage of this construction for off-road vehicles is that the sidewalls have reinforcement, thus providing some protection against their impact damage. Fly tires are constructed using individual cords running from bead to bead in a line perpendicular to the circumferential centerline of the tire. Thus the crown angle is 90°. There are also a Dumber of belts consisting of several cords, which are fitted on top of the radial plies. The cords within these belts form a crown angle of 20°. The belts are provided to brace the tread and prevent buckling around the periphery of the tire. The radial-ply tire provides, relative to the cross ply, uniform ground pressure over the contact area. The length of the contact patch relative to an equivalent cross-ply tire is longer, and thus the flotation characteristics of the radial tire are better. The radial tire is also likely to develop higher levels of drawbar pull than the equivalent cross-ply tire, particularly on light, sandy loam soils. The cross ply may show some improvement in performance relative to the radial ply, in terms of pull-slip characteristics, on wet, heavy clay soils (Anslow and Warrilow, 1970). The belted bias is designed as a combination of the radial- and cross-ply tire designs, although the principal plies are arranged in cross-ply configuration, set at a low crown angle.
25.2. TIRE SELECTION
A rational approach to tire selection based on coefficient of traction determined from mobility number was proposed by Gee-Clough (1980). This approach is based on the empirical models of Wismer and Luth (Chapter 4) and of Gee-Clough et al. (1982). The dimensionless term mobility number (M) is used in the empirical relationships. It is defined as
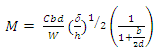 ----------------------------- (4.3)
where C is the soil cone index value, b the tire width, d the tire diameter, h the tire-section height, δ the tire deflection under load, and W is the dynamic load on the tire.
The tire deflection δ is normally measured statically on a hard surface, and a typical value of δ /h is 0.2 at the manufacturer's recommended load and inflation pressure. Gee-Clough took CI readings over several years and established values of 200, 700, and 1500 kPa to represent bad, average, and good field conditions, respectively. In order to accommodate the; effects of various operating parameters on the prediction of tractive performance, correction factors for (CT)max, K, and Crr were provided by Gee-Clough. These are reproduced in Table 4.1.
The correction factors are meant to be applied to a discrete situation and should not be combined. It is interesting to note that no correction factor is included for the tire aspect ratio. Change in aspect ratio will affect tractive performance; however, Gee-Clough noted that the range of aspect ratios commercially available is small and found no significant difference between a tire with an aspect ratio of 0.69 (advertised as a low aspect ratio) and a tire with an aspect ratio of 0.75.
Table 4.1. Correction Factors for Tractive Performance Parameters
|
Effect |
Traction conditions |
Correction factor |
||
|
(CT)max |
K |
Crr |
||
|
Radial ply compared to cross ply |
Bad |
0.95 |
1.38 |
1.00 |
|
Average |
0.95 |
1.38 |
1.00 |
|
|
Good |
0.95 |
1.38 |
1.00 |
|
|
High- lugged tires (i.e., 75 vs. 35 mm) |
Bad |
1.10 |
0.92 |
1.03 |
|
Average |
1.10 |
0.92 |
1.21 |
|
|
Good |
1.10 |
0.92 |
1.32 |
|
|
Forward-speed increase (3.2 to 6.4 km/hr) |
Bad |
1.01 |
1.00 |
0.98 |
|
Average |
1.01 |
1.00 |
0.98 |
|
|
Good |
1.01 |
1.00 |
0.98 |
|
|
Running in furrow bottom (instead of field surface) |
Bad |
- |
— |
— |
|
Average |
1.25 |
1.00 |
1. 00 |
|
|
Good |
1.23 |
0.69 |
1.80 |
|
In the following example, traction parameters are calculated for an axle carrying 14 kN, or 7 kN per tire. The traction parameters can be calculated as follows:
For a 9.5 x 24 agricultural drive tire with a load of 7 kN applied, the pertinent dimensions are,
tire breadth, b = 0.24m
tire diameter, d = 1.04m
tire aspect ratio, = 0.2
For bad conditions, the cone index C = 200 kPa.
The mobility number M is given from Eq. (5-25) as
![]()
The maximum coefficient of traction is given by
![]()
The coefficient of rolling resistance is
![]()
The slope of the coefficient of traction versus slip curve at the origin is
K(CT)max = 4.838 + 0.061M = 4.838 + 0.061(2.85) = 5.01
The slip at maximum efficiency was shown by Gee-Clough (1980) to vary little with mobility number M over the range of mobility numbers encountered for agricultural soils. It was therefore suggested that a slip value of 0.10 would represent a useful average figure for slip at maximum efficiency.
The tractive efficiency η is
![]()
where CT is the coefficient of traction and i the slip.
The coefficient of traction CT is given by
CT =(CT)max(1 – e-ki)
Where, K = K(CT)max/(CT)max
For the example given, K = 5.01/0.47 = 10.66. Thus,
![]()
The predicted tractive performance parameters for bad, average, and good traction conditions are given in Table 4.2.
Table 4.2. Predicted Tractive Performance Parameters for a 9.5 x 24 Agricultural Drive Tire
|
Tractive condition |
(CT)max |
K(CT)max |
CRR |
hmax |
|
Bad |
0.47 |
5.01 |
0.15 |
0.61 |
|
Average |
0.70 |
5.43 |
0.08 |
0.74 |
|
Good |
0.75 |
6.10 |
0.06 |
0.79 |
Tire selection for drive tires can be made on the basis of tires that meet the load specifications and provide the highest tractive efficiency under the ground conditions expected. This necessitates repeating the previous calculations for each tire option. If the tires are towed, then the selection is on the basis of that tire size providing the minimum coefficient of rolling resistance CRR. Tire options available will, however, be limited by the range of tire sizes commercially available, and by design limitations imposed by the machine size, etc. Single and dual tires can be compared by calculating the mobility numbers for each situation (Gee-Clough, 1980). If the duals are assumed to act independently of each other, to have width b, and to carry a load W/2, with diameter d, the mobility number is given by
![]()
For the same tire width, the single tire will have a width 2b, diameter d, and carry load W. The mobility number is given by
![]()
A comparison gives
![]()
The ratio is greater than 1, and thus duals will perform better than singles of the same overall dimension.
This approach can also be used to compare large single tires with smaller duals.
For duals of diameter dt, width bt, and load W/2, the mobility number is
![]()
For single tires of diameter d2, width b2, and carrying load W, the mobility number is
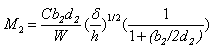
A comparison gives
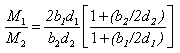
then M1/M2 will be greater than 1. In this case, the duals will have better tractive performance than the single tire.
Last modified: Wednesday, 19 March 2014, 12:30 PM