Site pages
Current course
Participants
General
Module 1: Fundamentals of Reservoir and Farm Ponds
Module 2: Basic Design Aspect of Reservoir and Far...
Module 3: Seepage and Stability Analysis of Reserv...
Module 4: Construction of Reservoir and Farm Ponds
Module 5: Economic Analysis of Farm Pond and Reser...
Module 6: Miscellaneous Aspects on Reservoir and F...
Lesson 12 Estimation of Seepage Flow
12.1 Introduction
Seepage through the earthen embankment has to be controlled to ensure the safety of the embankment as well as to minimize the loss of water. When water is standing against the earthen embankment a seepage line or saturation line (also known as pheratic line) is established. It is the line below which there are positive hydrostatic pressures. On the line itself the pressure is atmospheric (hydrostatic pressure is zero). Above the seepage line in the capillary fringe, the pressures are negative. Even though some flow occurs in the capillary fringe, in the analysis of seepage through embankment, the flow in the capillary fringe is usually neglected. In a given embankment section it is necessary to predict the position of the seepage line in order to (1) ensure that the seepage line does not cut the downstream face of the dam and cause softening or sloughing of the toe, (2) obtain the dividing line between the wet and dry soil for the purpose of stability computations, and (3) obtain the top boundary line for drawing the flow net for seepage computations.
Several solutions for the determination of the discharge and the free surface through homogenous earthen embankment have been developed. Each of these procedures makes use of Dupuit’s assumptions. Some of these procedures have been discussed here.
12.2 Dupuit’s Solution
The discharge per unit width (q) through any vertical section of the dam (Fig. 12.1) is given by

Integrating and substituting the boundary conditions x=0, y=h1 and x=L, y=h2
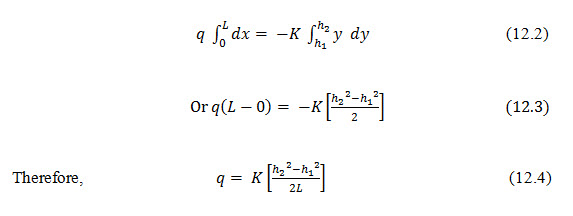
This equation specifies a parabolic free surface, commonly known as Dupuits parabola. In the derivation above no consideration has been taken of the entrance or exit conditions of the line of seepage or of the development of a surface of seepage. In fact in the absence of tail water (h2=0) the line of seepage is seen to intersect the impervious base. Also it should be noted that both the discharge quantity and the locus of the free surface are independent of the slopes of the dam.
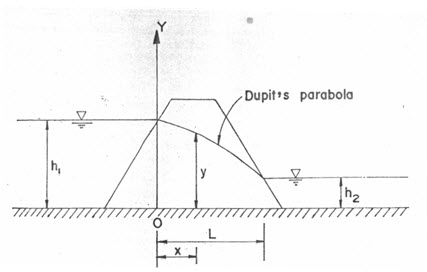
Fig. 12.1. Definition sketch for Dupuit’s solution.
(Source: Murthy and Jha, 2011)
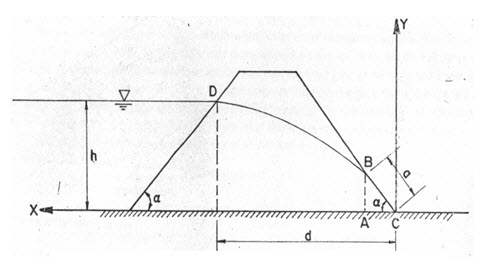
Fig. 12.2. Seepage line determination.
(Source: Murthy and Jha, 2011)
12.3 Solution of Schafferank and VanIterson
The first approximate method that accounts for the development of free surface was proposed by Schaffernak and van Iterson (1916).
Considering an earthen embankment on an impervious base (Fig. 12.2) with no tail water and applying Eq. 12.1 to triangle CAB, we obtain for the discharge per unit width (with x taken as + ve to the left)
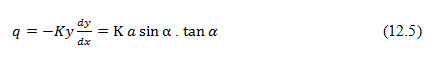
Where, a = length of seepage surface, and K= hydraulic conductivity of embankment material.
To determine the value of ‘a’ (Eqn. 12.5),

Unlike Dupuit’s solution, the parabolic free surface for this case is tangent to the downstream slope. It is required for the entrance conditions correction at the upstream slope. Casagrande recommended that point D0 (Fig 12.3) instead of point D be taken as the starting point of line of seepage. The actual entrance condition is then obtained by sketching in the area DF normal to the upstream slope and tangent to the parabolic free surface.
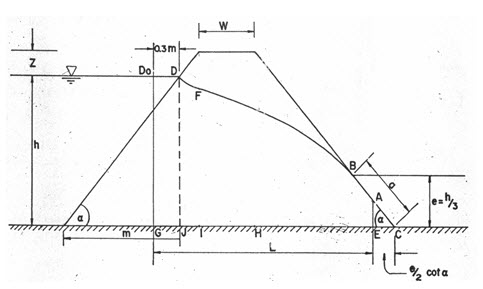
Fig. 12.3. Seepage line position in an earthen embankment.
(Source: Murthy and Jha, 2011)
In a homogenous embankment located on impervious foundation where the discharge slopes are flatter than 1:1 (Fig.12.3) it can be assumed that the point where the seepage line intersects the downstream face is given by.
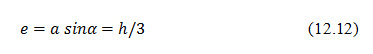
Where, e= distance from the impervious base to the intersection of the seepage line on the downstream side, and h=height of the water on the upstream side.
Using Darcy’s law the discharge through a unit width of embankment (q) can be calculated as follows;

Where, K= hydraulic conductivity of the material of the embankment, L= mean length of the seepage line (distance between the starting point of the seepage line D0 and the midpoint A of the seepage face BC).
Substituting for e=h/3 in Eq. 12.14 we obtain

In Fig. 12.3, L is given by
Where, Z = vertical distance from upstream water level to the top of embankment, W= top width of the embankment, and =angle of the downstream and upstream faces.
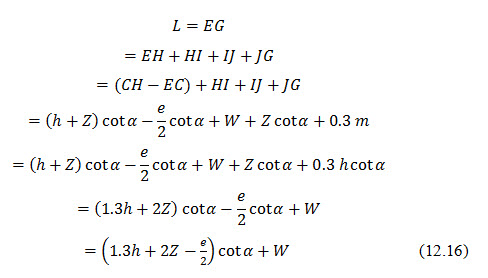
When pervious shells are provided in the upstream and downstream sides, the positions of the seepage line are shown in Fig 12.4. The upstream portion will have little effect on the position on the line whereas the downstream portion will act as drain.
If instead of the impervious foundation, a considerable layer of relatively pervious material overlies the impervious layer, discharge take place through the pervious stratum down to the impervious stratum in the foundation. In such cases, a hydraulic gradient line is assumed and at least 1 to 1.2 m of cover over the hydraulic gradient is provided. The gradient line may be assumed as a straight line with a slope of 1:1 in impermeable clay varying to 1:12 in sandy soil. In order to safely dispose the seepage water, toe drains or filters (Fig. 12.5) are provided.
Fig. 12.4. Seepage line in composite dam.
(Source: Murthy and Jha, 2011)
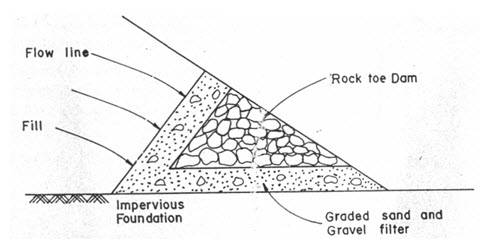
Fig. 12.5. Filter at the toe of the dam.
(Source: Murthy and Jha, 2011)
12.4 Freeboard and Wave Protections
Freeboard is the additional height of the dam provided as a safety factor to prevent overtopping due to unexpected runoff or by wave action. It is the vertical distance between the designed water elevation and the elevation of the top of the dam after settlement. This is also referred to as the net freeboard. The vertical distance between the crest of the mechanical spillway and the top of the dam is referred as the gross freeboard. The net free board should be sufficient to prevent the waves in the pond from reaching the top portion of the embankment where they can cause damage. Wave heights for moderate sized reservoirs are determined using Hawksley’s formula:
h=0.014(Dm)1/2 (12.17)
Where, h=wave height from trough to crest for maximum wind velocity in m, and Dm=fetch or exposure in m.
In addition to providing enough freeboard from wave height point of view, precautions are taken to protect the dam from wave damage. There are several methods for the purpose and the choice of the method depends on whether the water level remains fairly constant or fluctuates.
Vegetative and rip-rap are the methods used for controlling erosion by waves at the upstream side of the dam. Vegetative methods consist of establishing a thick grass cover on the slope. This is useful when wave action is not severe. If the water level in the pond remains fairly at a constant level, a berm of 2 to 3 m wide at this level controls wave action. Booms consist of a single or double line of logs chained together and suitability anchored are also used. They float on water very near the embankment and break the wave action. Rip-rap consists of loose stones or concrete blocks placed on the side of the embankment facing the water. Rip-rap is an effective method of protection from wave action. The layer of stones should be about 25 cm thick. Rip-rap could be made continuous upto the toe of the dam or a berm is to be provided at the place where the rip-rap terminates below the water level.
12.5 Seepage Charts
Seepage charts have been developed by the M. W. Stello (1987) (also known as Stello's seepage charts) basically as a practitioner's tool for rapidly estimating seepage quantities for both homogeneous and zoned embankments. The charts have been developed based on a computer program using the method of fragments. The method of fragments is an approximate method of seepage analysis and can be used for determining seepage quantities and the location of the phreatic surface for embankments with varying side slopes, heights, and crest widths. The method lends itself readily to computer application. The charts are applicable for any height of embankment with varying upstream, core, and downstream slopes, different core and shell permeabilities, and different crest widths and pool elevations. The quantities of seepage based on the charts give an average of 5%error as compared to published flow net solutions. Considering the profession's inability to estimate permeability accurately, the charts give very good results for rapid checks on seepage quantities and the location of the phreatic surface. The charts may be used as an aid in the construction of the actual flow net. A method is also helps to estimate seepage quantities for upstream sloping core embankments.
Keywords: Seepage, Stability, Phreatic line, Flownet, Earth dam
References
Murthy, V. V. N. and Jha, M. K. (2011).Land and Water Management Engineering.Kalyani Publishers.
Stello, M .W. (1987).Seepage charts for homogeneous and zoned embankments. J. Geotech. Eng., 113:996-1012.
Suggested Readings
Central Water and Power Commission (1960).Embankment Manual. Ministry of Irrigation and Power, New Delhi.
Rehbinder, G. and Wornman, A. (1994).Deformation of Dupuit’s parabola in a dam with sheet piling.Applied Scientific Research, 52:173-185.
Keady, G. (1990). The Dupuit approximation for the rectangular dam problem.IMA Journal of Applied Mathematics, 44, 243-260.
Suresh, R. 2002. Soil and Water Conservation Engineering. Standard Publishers.
Schaffernak, F. 1917. Über die Standicherheit durchlaessiger geschuetteter Dämme, Allgem. Bauzeitung.
Iterson, F. K. Th. van. 1916. Enige theoretische beschonwingen over kwel. De Ingenieer.
Last modified: Monday, 3 February 2014, 10:17 AM